
How To Apply Lean Problem Solving In Your Medical Device Operations
By Darren Dolcemascolo, senior partner and co-founder, EMS Consulting Group

In the first installment of Thinking Lean, I introduced the basic philosophy of lean and an overview of its tools and methods. In this article, I will talk about the most foundational aspect of lean — lean problem solving — and will provide a step-by-step process for applying this approach within a medical device company.
Recall that lean involves working toward providing the customer with a defect-free product or service when it is needed and in the right quantity. In order to practically work in this direction, organizations need every employee thinking the same way. This thought process is most commonly called A3 problem solving, and it involves following the PDCA (plan–do–check–act), or PDSA (plan–do–study–act), methodology popularized by quality guru W. Edwards Deming. This process is used at all levels of the organization for strategic issues as well as tactical, front-line issues.
Let's begin by asking the question: "What is a problem?" This might seem obvious. However, having had the experience of asking many dozens of audiences this question, I can confidently assert that most people do not have a broad enough view of what a problem is. A problem is the gap between the current condition and the target condition or standard. A problem-solving process aims to identify the primary causes or obstacles preventing us from reaching the target condition and then take actions to eliminate the obstacles/causes and reach the target condition.
PDCA has four basic components:
1. Plan: The plan portion of PDCA includes developing an action plan for improvement. In the context of problem solving, this would include all of the following major components:
- Defining a problem, the gap between the current condition and the target condition or standard.
- Performing a root cause analysis of the problem utilizing tools and concepts such as the 5 Whys, a fishbone diagram, and other qualitative or quantitative tools. Here we are asking, “What prevents us from reaching the target condition?” The output should be the critical causes or obstacles.
- Creating “mini” PDCA experiments in which potential countermeasures to the problem are tested, and the learning from those tests is fed back into the process.
- Plan to experiment
- Do the experiment
- Check or study the results of the experiment
- Act by utilizing what you’ve learned from the experiment.
- Developing a plan to fully implement the countermeasures.
2. Do: The do portion of PDCA is implementation. One of the 14 principles of the Toyota Way, as defined by Jeffrey Liker, includes the idea of rapid implementation. The plan portion of PDCA should be done very methodically, through experimentation and by building consensus; the do portion should be rapid.
3. Check (or study): The check step is similar to the control phase of a Six Sigma project; it includes verification that the solution is working. This is done by continuing to monitor and study the effects of what was done in the do phase.
4. Act (or adjust): The act phase of PDCA includes two major components:
- Making necessary adjustments to solutions and action plan based on what was discovered during the check phase.
- Identifying future steps related to the problem/area being addressed.
Lean companies document their problem solving activities on an A3. A3 refers to the 11” X 17” paper size, and A3 reports are used to tell entire stories using graphs, pictures, and limited verbiage on one sheet of 11” X 17” paper. While they can be used for more than just PDCA problem solving, they are most commonly used for this purpose. In such cases, A3 reports would include the following information:
- Problem description and definition
- Root cause analysis
- Countermeasures
- Implementation plan
- Results
- Follow up and future steps
Let’s walk through an example of this problem-solving process, step by step. Let us suppose that our packaging department overtime has been increasing over the past several months, and that we would like to return to last year’s level of overtime.
1. Problem Definition: To define the problem, we would have to think about putting it in terms of a current or actual condition versus a desired or target condition. After thinking through the issues, the supervisor of the packaging department might decide to define the problem as follows:
“The packaging department has failed to meet its planned production during normal working hours 70% of the time over the past three months, resulting in excessive overtime. The target condition is to meet plan 95% of the time and reduce overtime to less than $1000 per month.”
She might include the following charts to illustrate her claim.


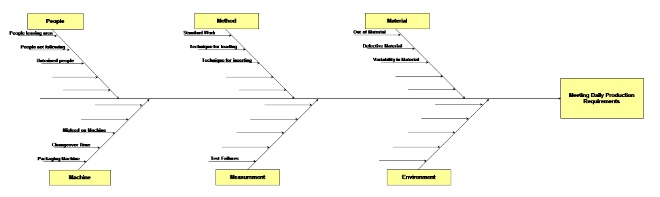
2. Root Cause Analysis: The next step is root cause analysis. While many tools can be used to perform root cause analysis, we will focus on two of the most basic and useful: The fishbone diagram and the Pareto chart. First, we will utilize the fishbone, or cause and effect, diagram.
The cause and effect diagram or fishbone diagram is a graphical tool for identifying the relationship between a problem and its potential causes. One of the most effective ways of constructing such a diagram is to brainstorm potential causes in a team environment. For example, a cause and effect diagram might be used to determine possible causes of a recurring defect in a manufacturing process.
The fishbone diagram is drawn to resemble the skeleton of a fish, with the issue (problem or process condition) on the right side. The major cause categories are written in the boxes on the left side of Cause and Effect Diagram. Summarize the major causes under the categories. The basic categories are usually people, methods, machines, and materials. Sometimes, other categories such as measurements and/or environment are added.
Our supervisor might work with her team of associates to determine what the causes might be. She might ask the question: “What prevents us from meeting our daily production requirements?”
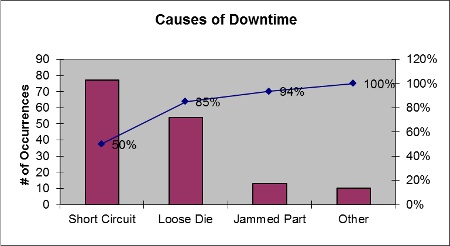
The next step after creating a cause and effect diagram is to narrow down the obstacles or causes to the vital few. This is best accomplished through Pareto analysis. Pareto analysis is based on the 80/20 rule, the idea that 20% of the causes (the vital few) accounts for 80% of the problem. The packaging department keeps track of each time it fails to meet production requirements on an hourly basis. Each time it fails to meet the planned production, a reason is written down. The supervisor tallies these reasons on a Pareto chart, which sorts from the greatest to the least.

From this analysis, we can see that packaging machine downtime accounts for 64% of the instances where the plan is not met. An additional 19% is from test failures. Together, these two causes account for 83% of the problem.
Next, the supervisor breaks down the primary cause further. She asks the question, “Why does the packaging machine break down?” She might create another fishbone diagram to identify potential causes of downtime and then begin tallying the causes each time, creating another Pareto chart.
In summary, the supervisor and her team now understand the critical causes of missing the planned production.
3. Countermeasures: The next step is to identify and test countermeasures. This is accomplished by brainstorming potential countermeasures to address the critical causes. While there are many ways to do this, the supervisor uses a silent brainstorming method, in which each team member writes down his or her ideas on a sticky note (one idea per note). The notes are then gathered on a white board in front of the team in a conference room, and each idea is discussed and ranked. The team narrows down the proposed countermeasures by evaluating their impact and effort using an impact/effort matrix.

An impact/effort matrix evaluates both impact and effort on a scale of 1 to 5. Countermeasures that have the biggest impact and the lowest effort (quadrant 4 above) are of the highest priority. While ideas that have the lowest impact and highest effort (quadrant 2 above) are typically eliminated. The team selects the most important ideas and begins testing them.
4. Implementation plan: The next step is implementation planning. Those ideas that have been tested successfully are implemented. Some are implemented immediately because they are very simple ideas, while others require days or even weeks to fully implement. The team develops a simple action plan that outlines the tasks, task owners, and planned completion dates.
5. Evaluation of results: The next step is the act (or adjust) phase. What was implemented must now be evaluated to ensure that it is working and continues to work. The team measures both planned-vs.-actual production and overtime to confirm that the countermeasures are working and that the target condition is achieved. Below, we can see that production is meeting plan as the countermeasures are implemented beginning on day 12.

6. Next steps: The final part of the act stage is to determine what the next problem to work on will be. In other words, “What is the next target condition we need to achieve and where are we now?” This then begins the next A3 problem solving effort.
By following this problem solving methodology for strategic issues as well as tactical, front-line issues, medical device organizations can gain a competitive advantage. In my experience, medical device companies all have standard root cause analysis processes, but they are generally used only as a form rather than a thought process. Having a problem-solving mindset at all levels of a medical device company will give it a similar advantage today that Toyota had over its American competitors 30 years ago.