
Total Productive Maintenance - Part 1
By Darren Dolcemascolo, senior partner and co-founder, EMS Consulting Group

Over the last few editions of Thinking Lean, we have been talking about tools that support continuous flow and pull systems. In this two-part analysis, we will explore another very important methodology for facilitating manufacturing flow within a medical device company, Total Productive Maintenance (TPM).
What is Total Productive Maintenance?
Often an overlooked component of a lean manufacturing program, proper equipment maintenance is key to lean manufacturing success. Continuous flow manufacturing will not allow for frequent, unplanned equipment down-time. TPM is an excellent method for meeting the demands continuous flow manufacturing places on equipment. It is a team-based approach to improving equipment availability and performance. TPM focuses on the following:
![]() It increases Overall Equipment Effectiveness (OEE) using improvement activities.
It increases Overall Equipment Effectiveness (OEE) using improvement activities.- It reduces the so-called “Six Big Equipment Losses.”
- It establishes an autonomous maintenance program performed by equipment operators.
 It increases Overall Equipment Effectiveness (OEE) using improvement activities.
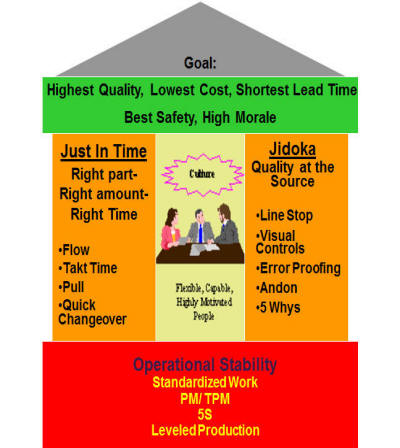
This results in an increase in operational stability. Note that TPM falls under the Operational Stability foundation of the TPS house.
TPM is aimed at eliminating the six big losses:
- Breakdown losses
- Setup and adjustment Losses
- Idling and minor stoppage losses
- Speed losses
- Quality defects and rework
- Start-up/yield losses (reduced yield between machine start-up and stable production)
OEE is the key metric in determining how well equipment is performing with regard to the six big losses. OEE measures equipment effectiveness in terms of availability, performance, and product quality. Availability tells us what percentage of time the equipment is actually running when we need it, and is calculated as follows:
Availability = Operating Time / Loading Time X 100 percent
where:
- Operating Time = Loading Time – Downtime
- Loading Time: The daily, weekly, or monthly time available for operation, minus planned stops (breaks in the production schedule, stops for planned maintenance, meetings, etc.)
- Downtime: total time for unscheduled stops (breakdowns, re-tools, adjustments)
Performance is based on two factors: operating speed rate and net operating time. The operating speed rate tells us how fast a machine is running compared to its designed/ideal speed. The net operating time is the time during which equipment is being operated at a constant speed within a specified period. Performance is calculated as follows:
Performance Rate = Net Operating Time X Operating Speed Rate
where:
- Net Operating Time = (units of output x actual cycle time per unit) / (loading time – downtime) X 100%
- Operating Speed Rate = ideal cycle time / actual cycle time per unit X 100 percent
- Quality rate is simply the rate of quality products, or 100 percent - defect rate.
Finally, we calculate OEE:
Overall Equipment Effectiveness (OEE) = Availability X Performance Rate X Quality Rate
After the above metrics are calculated for each piece of equipment, equipment improvement project teams determine which losses have the greatest impact on equipment effectiveness, and then prioritize improvement efforts accordingly, based on the biggest opportunity:
- Availability relates to setup and adjustment losses, as well as breakdown losses
- Performance relates to idling, minor stoppages, and speed losses
- Quality relates to quality defects and to start-up/yield losses
Below is an example of an OEE Calculation from an injection molding machine at a medical plastics company:
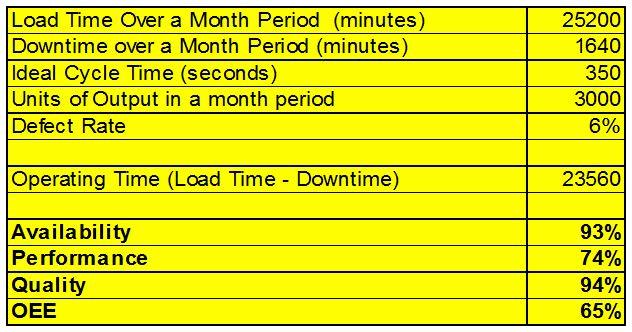
The load time over a month period is 25,200 minutes. Of that, 1,640 minutes are downtime. The product cycle time is 350 seconds per unit, and unit output for the month is 3,000. The defect rate is 6 percent. Availability is equal to operating time divided by load time. To determine actual operating time, we must subtract downtime from load time. This gives us 23,560 minutes of operating time for the month. Thus, availability is 23,560 divided by 25,200 (93 percent). Performance equals monthly units of output times ideal cycle time, all divided by operating time. Thus, 350 seconds times 3,000 units, divided by 60 seconds, divided by 23,560 minutes, equals 74 percent. Quality equals 100 percent minus the defect rate of 6 percent (94 percent). Thus, OEE is 65 percent.
Let us consider how OEE relates to each of the six big losses:
- Breakdowns — Metrics we might use to measure breakdowns include the number of breakdowns per month and the average length of each breakdown. The OEE component affected by breakdowns is availability.
- Setup/Adjustment — We simply track the amount of time spent on these processes per month or per setup. This loss also affects availability.
- Idling And Minor Stoppages — Two metrics to address this loss include idling and minor stoppages per machine per month, and idling and minor stoppage time per machine per month. Idling and minor stoppages affect performance rate.
- Speed Loss — Here, we might track actual cycle time versus ideal cycle time. This affects performance rate.
- Quality Defects — While there are many metrics we might use to track this, defect rate, scrap rate, and rate of rework are three good examples. Obviously, quality defects loss affects the quality rate component of OEE.
- Start-Up Losses — Start-up yield is the metric we would use to gauge start-up losses. These losses also impact quality rate.
Using the metrics above for each of the six big losses, problem-solving teams must find out which losses have the biggest impact on equipment effectiveness, and then prioritize their improvement efforts accordingly. They would do this by first measuring the extent of the six big losses, determining how much each loss affects OEE, and identifying problems that are preventing improvement of availability, performance, and quality. Then, they must determine the people and methods needed to solve problems identified. Finally, they will calculate the effects of better equipment effectiveness on business metrics and overall value stream improvement.
Returning to the example of a medical plastics company with an OEE of 65 percent, since performance is the lowest component (at 74 percent), it might represent the best opportunity for improvement. The performance component of OEE relates to speed loss, as well as idling and minor stoppages. The medical plastics company would engage in problem solving to determine the causes of specific losses. This would lead to improved performance and improved OEE.
Each element of TPM is important for a lean medical device manufacturer. Improving availability, performance, and quality on equipment will improve flow, reduce inventory, and provide a competitive advantage. In our next article, we will discuss Autonomous Maintenance programs, a key part of TPM that helps to sustain better equipment performance.