
Value Stream Mapping For Medical Device Companies, Part 1
By Darren Dolcemascolo, senior partner and co-founder, EMS Consulting Group

In this and the next edition of Thinking Lean, we address value stream mapping, which is a high-level, strategic methodology for developing an improvement plan for a product or service line. The value stream mapping methodology was introduced by Mike Rother and John Shook in their classic workbook Learning to See, originally published in 1998. Value stream mapping is used to identify and then work toward a future state following the plan-do-check-act (PDCA) methodology introduced in my last article. Value stream mapping can be used in the medical device world for analyzing and improving order fulfillment, product development, and even support processes.
A value stream is defined as all of the activities needed to deliver a service or product to a customer. In general, it begins with a customer order and ends with delivery of the order or payment collection after the order has been delivered — it is the entire cycle. For a typical medical device company, this cycle includes purchasing activities, planning or scheduling activities, production activities, material movement activities, and many others. The purpose of looking at the entire flow, from customer order through to delivery (or payment), is to understand where the breakthrough opportunities are. Through the value stream mapping process, we identify and then plan to implement these breakthrough opportunities.
The value stream mapping process involves the following activities:
- Identify the scope and team
- Map the current state
- Map the future state
- Develop a value stream plan
In this article, we will discuss the first two steps.
Step 1 — Identify The Scope And Team
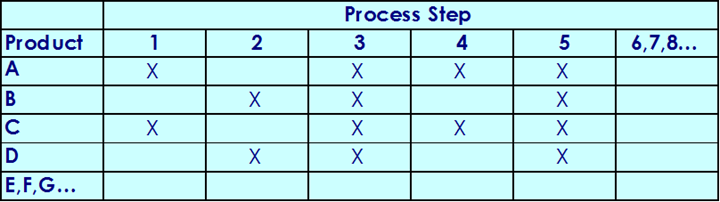
First, organizations must identify their value streams. I recommend beginning with value streams that touch the end customer. For a medical device company, these are the fulfillment activities for product lines themselves. Each product line or product family might be considered a value stream. If it is difficult to break up products into families, consider creating a matrix that shows products (or part numbers) versus the processes or operations that they utilize, as we see in the figure below. A rule of thumb is that if a set of part numbers or products has 70 percent or more commonality in operations/processing, it can be considered a value stream.
After identifying our value streams, we must select which value stream we would like to improve first. A very visible, high-growth, and/or high-volume value stream would make the most sense.
Once we have determined which value stream to map, we must identify the team to work on this activity. The team should be made up of managers with decision-making authority. While it is important to include front-line workers in a kaizen event (in which a more detailed process knowledge is needed), for a value stream activity we need to make more strategic decisions about the overall flow of work in the future. The team make-up should cover the entire flow of work. For mapping a product line, this would include purchasing, sales, operations/manufacturing department managers, finance, and distribution.
Step 2 — Map The Current State
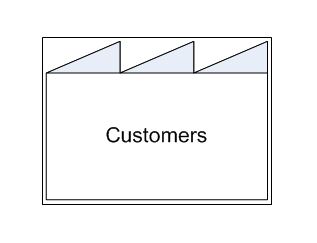
The current state is a snapshot of the activities needed to deliver the product or service. After we’ve selected a product line to map, we must identify the customer requirements for the product line. This would include things like lead time/delivery time to the customer, average volume demanded, and quality requirements. A customer icon, pictured below, will be in the upper right hand side of a map when mapping a door-to-door value stream.
Next, we identify the main processes. Eventually, we will create a process box for each process. A process box in a value stream is an area of material flow in which there are no significant delays or inventory. Wherever there is a delay, there would be a new process box. For example, if we have two assembly processes and a small amount of inventory between them, each would be a separate processing box. If, on the other hand, we had two people doing assembly utilizing continuous flow in a cell, the cell would be only one process box, as there would not be any significant delay or inventory between the two steps.
After we identify the processes, we must identify the metrics to be collected. At a minimum, we should include:
- Processing time (P/T) — The amount of hands-on operator time or the amount of machine time spent on one unit is processing time. We would have separate entries for these where machines cycle automatically, though. For example, we might have a 30-second machine cycle time and 10 seconds of manual operator work to load and unload the machine.
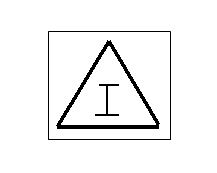
![]() Inventory — Inventory includes a count of any inventory waiting between processes. We generally represent this with a triangle inventory icon.
Inventory — Inventory includes a count of any inventory waiting between processes. We generally represent this with a triangle inventory icon.- Lead time (L/T) — Lead Time is the elapsed time through a process; it includes waiting time up front as well as processing time. Lead time is calculated in one of two ways:
- Dividing the inventory between two processes by the number of units consumed, per day, by the customer. For example, if we have 100 units waiting, and we sell 25 units per day on average, we have about 4 days of lead-time.
- Measuring the actual lead time for a process. We would measure the elapsed time from when a process receives material from the previous process until that material is completely processed and moved to the next stage.
- Yield, % defective, defects per unit (DPU), etc. — These are quality metrics for manufacturing processes. Typically, for administrative processes, % Complete and Accurate (% C&A) is very useful. Administrative processes often struggle with receiving incomplete or incorrect information.
- # of operators — This is the number of people working/available in a process.
- Available working time — This would be defined as how much time per day or per shift is available for the process. We would take the entire working day minus breaks, planned meetings, planned cleanup time, and any other planned activity that takes time away from the process.
 Inventory — Inventory includes a count of any inventory waiting between processes. We generally represent this with a triangle inventory icon.
Other metrics to include, as needed, would be:
- Changeover time (C/O) — This is the setup time between different product runs on a machine. This should be measured as the elapsed time between when the machine was stopped from the previous run through the time when the first good part comes off the machine on the new run.
- Machine uptime, or reliability — This is the percentage of time that a machine is available, and is not down for maintenance/repair. Alternatively, overall equipment effectiveness (OEE) may also be used as a metric; this is calculated as availability x performance x quality rate.
- Software/system used — Here, we would identify the systems used (e.g., ERP systems, spreadsheets, and databases) in the process. In administrative processes and even in manufacturing processes, we discover disconnects and redundancies as a result of multiple systems that don’t talk to each other.
- Pack size — If a product is packed/sold in multiples, we may want to include this information in our data box. For example, a product might be sold in packs of five or 10.
The next step is to create and layout each process box with data below it. In most cases, we are creating this on the wall of a conference room. If this is the case, consider using large sticky notes to depict each process box with data.
The last step to create a current-state map is to connect the boxes and to calculate the total lead time versus the value-creating time. To connect the process boxes, we must find out how they are related. Is there a relationship or defined agreement between the production processes, or do we have a push system in which each process works off its own schedule? To calculate total lead time, we add up the lead times of all of the processes, and to calculate the total value-creating time, we need to add up all of the processing times for each step.
Example: “ACME Med Devices”
Let us now consider an example and walk through the steps. Imagine a company that manufactures medical diagnostic equipment — we’ll call it ACME Med Devices. It purchases many components, has some in-house fabrication, and assembles and tests its product. Let us imagine that for one of its value streams, it has categorized its product into three categories: A, B, and C. While each of these product categories go through the same processing steps, each one takes a different amount of time. A items are the simplest, B take more time to manufacture, and C items are the most complex of the three.
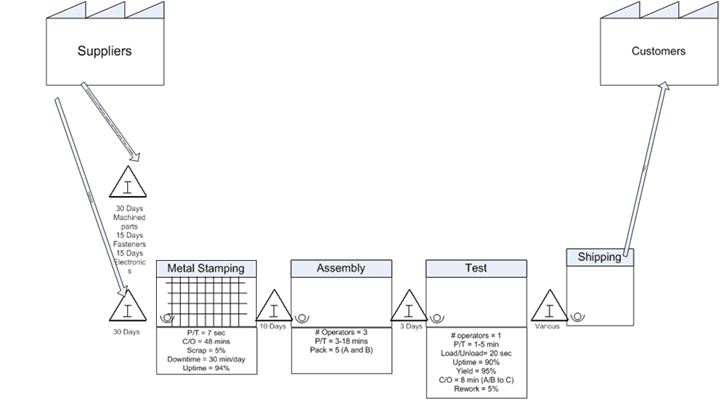
Beginning in the upper right hand side, we have our customer icon. Since this value stream services many customers, we use one general icon for customers. In some cases, a value stream would service only one or two customers. In such cases, we would have specific customer names. Next, we move backwards along the material flow on the bottom of the map with the following process boxes:
- Shipping: We add a process box for shipping and an arrow from shipping to the customers, showing daily shipments. Next, we add an inventory icon before shipping. We will not write the quantity below it since, in this case, quantity is variable for the three products within the value stream.
- Test has following characteristics:
- Processing time, shown by P/T, ranges from 1 to 5 minutes.
- Load/unload time is 20 seconds per part.
- Uptime is 90 percent
- Yield is 95 percent
- Changeover time is 8 minutes
- Rework rate of 5 percent
- Inventory waiting for test: three days
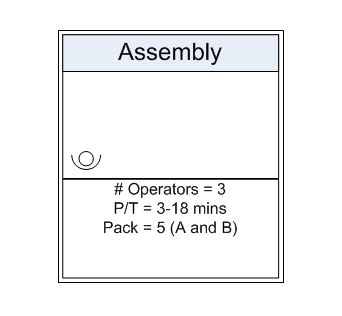
- Assembly has the following characteristics:
- Three operators
- Processing time of 3 to 18 minutes
- Pack size of five units for A and B products
- Inventory waiting for assembly: 10 days
- Metal stamping has the following characteristics:
- It is shared between multiple value streams/product lines; we show a grid within the metal stamping process box to indicate this.
- Processing Time: 7 seconds
- Changeover Time: 48 minutes
- Scrap rate of 5 percent
- Downtime of 30 minutes per day
- Uptime of 94 percent
- Inventory: 30 days of metal waiting for stamping, and then other purchased parts, including 30 days of machined parts, 15 days of fasteners, and 15 days of electronic components.
- Suppliers are represented by the icon in the upper left side. Note that we could have included multiple suppliers, or specific, key suppliers, in this map.
The figure below shows what we would have drawn up to this point.
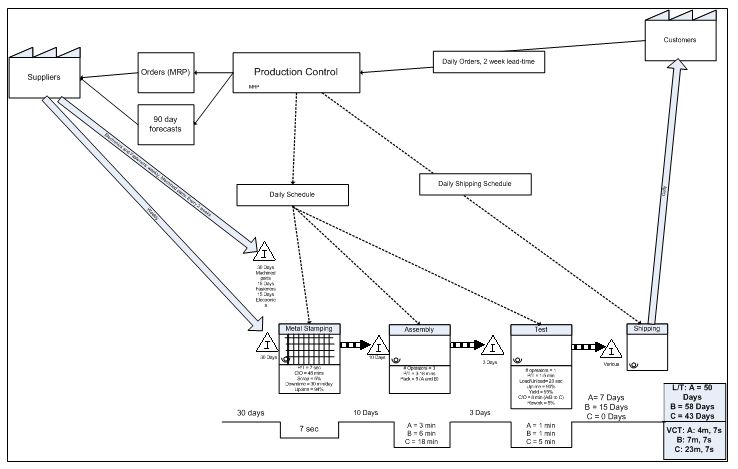
For the information flow, we begin with daily orders arriving from the customer and going to Acme’s production control. Next, we connect Acme to its suppliers, showing orders driven by material requirements planning (MRP) and forecasts going from production control to the suppliers. Then, we connect production control to manufacturing, showing a daily schedule that is sent to metal stamping, assembly, and test. Also, a daily shipping schedule is sent to shipping.
Now that we understand how each manufacturing process knows what to make, we can determine how each is connected. How is metal stamping connected to assembly? Is there a defined relationship? Since each area works off its own schedule, there is no defined relationship. Thus, we have a push system. We would draw in push arrows between metal stamping and assembly, between assembly and test, and between test and shipping.
We then draw in our timeline and summary metrics. The top portion of the timeline will show lead time, estimated by days of inventory, while the bottom portion of the timeline will show value-creating time — time in which the product is being transformed.
- 30 days of lead-time, because the maximum amount of inventory is 30 days.
- 7 seconds of value-creating time in stamping
- 10 days of lead time between stamping and assembly
- 3, 6, and 18 minutes of value-creating time for A, B, and C products, respectively, in assembly
- Three days of lead-time before test
- 1, 1, and 5 minutes of testing time for A, B, and C items, respectively
- Seven, 15, and zero days of finished “good” inventory for A, B, and C items, respectively
Finally, we sum up the lead time and value-creating time. For lead time, we have 50 days for A, 58 days for B, and 43 days for C. Value-creating time is 4 minutes, 7 seconds for A; 7 minutes, 7 seconds for B; and 23 minutes, 7 seconds for C. This large gap between value-creating time and lead time is typical. Below is our finished current-state map.
In the next article, we will talk about the steps to creating a future-state map and planning implementation.