
A Better Interpretation Of POH In ISO 24971
By Adam Atherton, PE, RAC, independent consultant

Anyone who has been doing risk management for medical devices or combination products is familiar with the ISO 14971:2019 and ISO/TR 24971:2020 standards. These recognized standards describe a risk management process that has been implemented across industry for many years.
It is commonplace for organizations to closely follow the process and examples in the standards, even though they are not compulsory. Several ways organizations follow the standards are in the risk matrix, aka risk scoring, and the severity and probability categories. The majority of organizations have implemented the 5x5 risk scoring table with the five severity categories and the five probability categories as shown here (Ref ISO/TR 24971:2020 Figure C.1). Note: Organizations need to set risk evaluation criteria but do not have to set it as shown here.
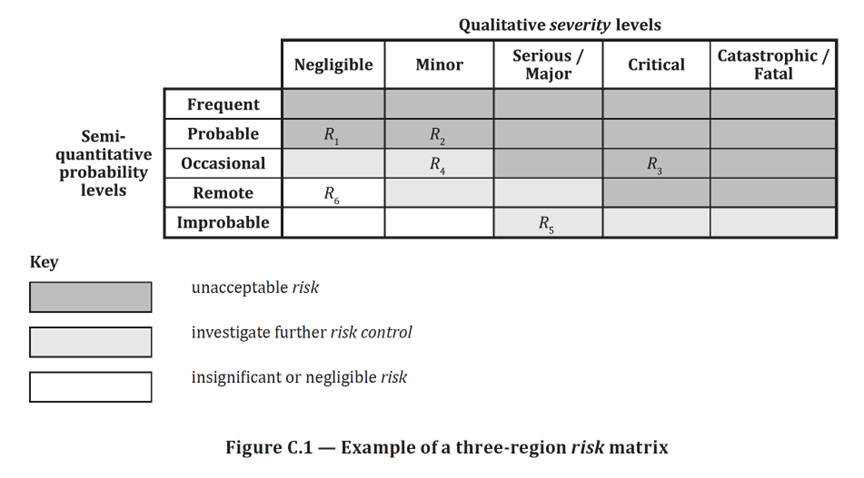
Figure 1 in this article is Figure C.1 in ISO/TR 24971: 2020.
© ISO. This material is adapted from ISO/TR 24971:2020 with permission of the American National Standards Institute (ANSI) on behalf of the International Organization for Standardization. All rights reserved.
Furthermore, it is common for organizations to not only use the probability terms but also their associated ranges as described in ISO/TR 24971:2020 below.
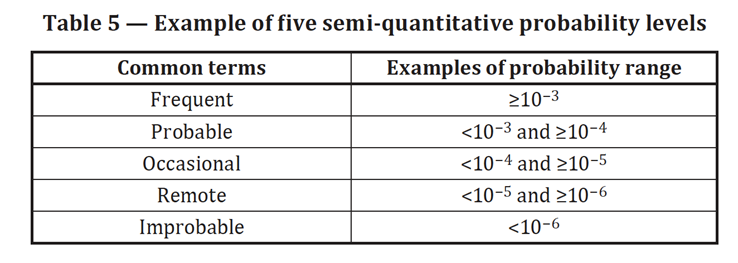
Table 1 in this article is Table 5 in ISO/TR 24971: 2020.
© ISO. This material is adapted from ISO/TR 24971:2020 with permission of the American National Standards Institute (ANSI) on behalf of the International Organization for Standardization. All rights reserved.
The semi-quantitative probability levels in Figure 1 above and the risk matrix are known as the probability of occurrence of harm (POH), which is usually a combination of two probabilities, P1 and P2. The probability P1 is the probability that a sequence of events leads to a hazardous situation. The probability P2 is the probability that if the hazardous situation occurs a given severity harm(s) will occur. Both ISO 14971:2019 and ISO/TR 24971:2020 show POH=P1*P2; more on that later.
The value in addressing both P1 and P2 is it helps focus attention on different areas of risk. The probability P1 is where risk can be reduced by changing the design to eliminate all or part of a risk or a protective measure can be implemented to reduce exposure to the risk or labeling can be used to inform the user of the presence of residual risk. This is where teams can add significant value to the overall solution. The probability P2 is driven more by physiology, so once determined by medical or clinical personnel, it remains fixed for the hazardous situation-harm.
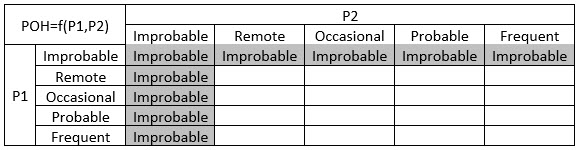
If the POH probability ranges are as described in Figure 1 above, what are the ranges for P1 and P2? There is nothing that requires P1 and P2 to use the same probability range; indeed, it is not advisable. If P1, P2, and POH all use the same probability range shown in Figure 1, probability ends up being suppressed and 40% of the risk matrix (two of the five rows in the 5x5 risk matrix) are not used because the higher probabilities, Probable and Frequent, don’t appear, as shown below.
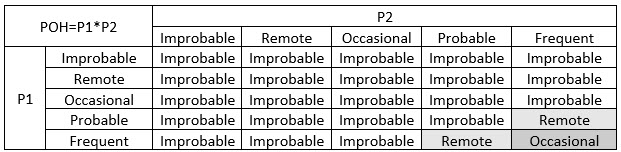
Again, mathematically it may make sense but practically and logically this approach needs improvement. This is part of the reason organizations do not use the same scale for P1, P2, and POH. Another problem is blindly assuming POH must be P1*P2. Even ISO/TR 24971:2020 is explicit in stating this is not necessarily the case when it says, “Decomposition into P1 and P2 can be useful to estimate the probability P of occurrence of harm [POH], but such decomposition is not mandatory.” So, organizations can implement the probability ranges in the standard as they deem appropriate and the P1, P2, and POH can all have different scales.
POH is critical to appropriately scoring risks, so how should it be done? Since POH leans heavily on P2, clinical personnel must be on board with how POH is determined. Also, as mentioned earlier, POH needs to show all probabilities, not suppress them. And, of course, it needs to make sense. Organizations are free to choose what is most appropriate for their QMS, and some have adopted a POH similar to the following, assuming a 5x5 Severity/Probability scale is used.
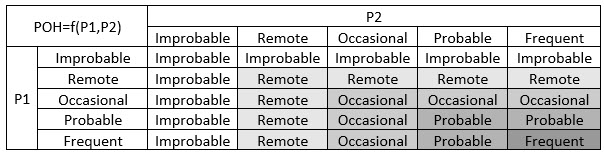
This POH is not generated mathematically but logically. This POH tilts toward lower probabilities when a higher and lower probability are considered; for example, a POH of Occasional results when a P1 of Probable and a P2 of Occasional interact. When both P1 and P2 are the same category, POH is the same as P1 and P2. And, in general, as probabilities P1 and P2 increase from left to right or up to down, the POH increases.
Here is how this table was generated. The table is symmetrical about the diagonal because we are using the same number and categories for P1 and P2.
- Assume Improbable is ~0. Multiply Improbable by each of the terms to get Improbable or ~0. For example, Improbable or ~0 * Occasional = Improbable or ~0.
- Assume Frequent is ~1. Multiply Frequent by each of the terms to get the multiplied term. For example, Frequent or ~1 * Remote = Remote. Also, note Improbable or ~0 * Frequent or ~1 = Improbable or ~0 still.
- On the upper left we have Improbable and in the bottom right we have Frequent. There are three cells on the diagonal between these extremes and there are three probability categories between the extremes. We choose to fill the three cells with each of the probability categories in order, as shown.
- We “Sodoku” the remaining cells. For the cell P1=Remote, P2=Occasional, the category needs to fit between POH Occasional and POH Improbable. Remote is between Occasional and Improbable. We fill in two cells because POH is symmetrical about the diagonal. We continue for the remaining cells.
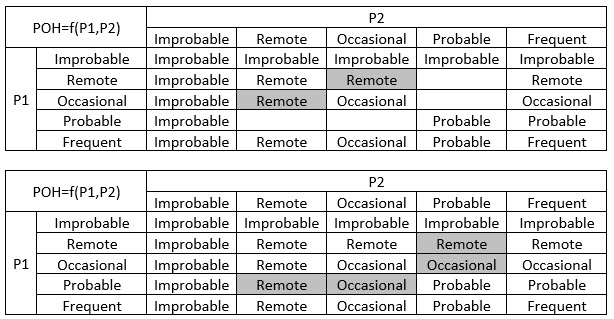
For every P1 and P2 combination, we use the POH lookup table to predict the probability of occurrence of harm used in the risk scoring table.
In conclusion, avoid inadvertently suppressing POH by not using the same scale to score P1, P2, and POH. A POH table has been proposed (it is used in industry already) that takes the five categories of P1 and P2 together and generates an appropriate probability of occurrence of harm to be used in the risk scoring table.
About the Author:
 Adam Atherton, PE, RAC, is an independent consultant to medical device and combination product manufacturers. He develops strategies to address technical feasibility, new product development, remediation, regulatory, clinical, manufacturing, and post-market surveillance for Fortune 200 medical device and pharmaceutical companies as well as startup ventures. He manages key aspects of design control, risk management, product architecture, and quality systems. He graduated from Naval Postgraduate School with his MSEE degree and from California State University, Fresno with his BSEE degree. He can be reached at athertonpe@gmail.com.