
A Much-Improved Approach For Understanding And Managing Safety Risks
By Mark F. Witcher, Ph.D., biopharma operations subject matter expert
Safety is an essential part of every enterprise, including the pharmaceutical and medical device industries. This article describes how causal mechanism and effect analysis (CMEA)1 and its principles can be used to develop and maintain safer working environments.
CMEA provides two complementary analysis methods for keeping everyone safe. The first resembles the classical Swiss cheese model of control barriers blocking threats to prevent harm. The second is CMEA’s benefit risk model that can be used for safely achieving a sought-after objective. If safety risks are viewed from both perspectives, a much more powerful understanding of how to keep people safe can be achieved.
CMEA uses a relational risk analysis (ReRA) modeling strategy2 that describes a risk as a relationship between a cause event and an effect event connected by a causal risk mechanism. As shown in Figure 1, the relationship is an input cause event to a causal risk mechanism that produces the effect event as the risk’s outcome.
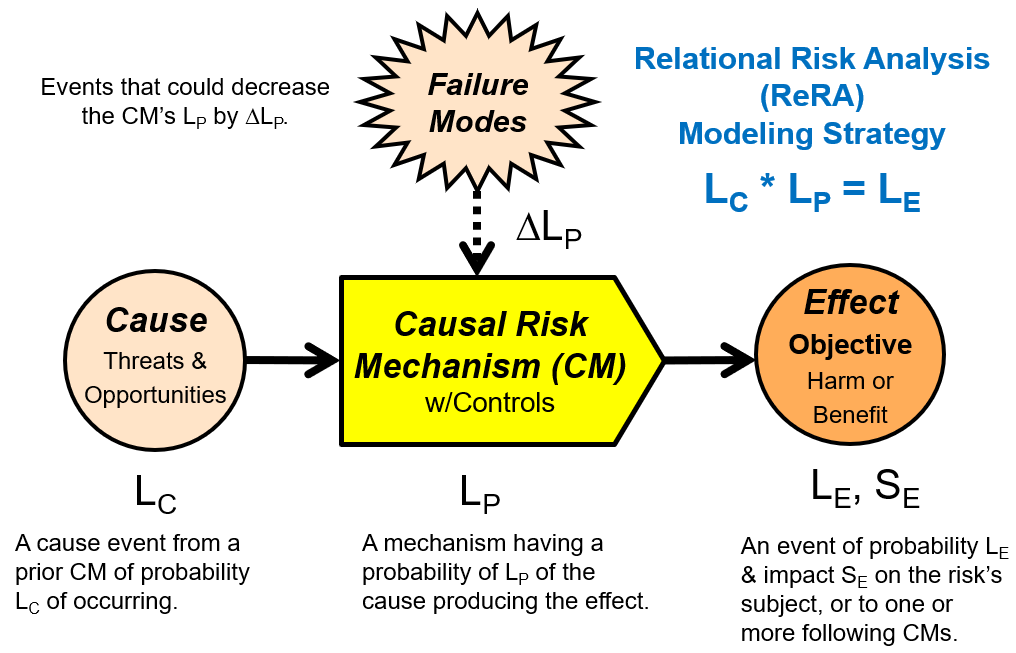
Figure 1: The cause event of probability LC enters a causal mechanism (CM) that has a probability LP of producing the effect event. The probability of the effect event occurring LE is equal to LC * LP. The CM’s probability LP might be impacted by one or more failure mode events (FMs) that might change LP, resulting in a possible change in LE. The FMs are also produced by their own CMs. The element shown can be used to describe sequences and networks of events, CMs, and FMs to structure and model both simple and complex risks, including safety risks.
The goal of every risk analysis is to identify the risk sequence and assure that the cumulative effect of the CMs reduces the likelihood of harm to as low as reasonably practicable (ALARP) by analyzing the CMs and making appropriate improvement modifications to the CMs when necessary.
A risk CM is defined as any combination of processes, systems, people, actions, activities, plans, equipment, instruments, or anything else that contributes to or explains how an input initiating threat or opportunity becomes the risk’s outcome in the form of a harm or benefit. The CM can be modeled as a single entity or as a sequence of mechanisms forming a system risk structure (SRS) from the risk’s initiating cause event to a final effect event impacting the risk’s subject. If any of the cause, CM, effect, or subject shown in Figure 1 changes, then a different risk is described by the SRS model.
The ReRA modeling strategy describes two types of risks.1 The first is a “harm risk” where the function of the CM is to minimize the likelihood of a threat producing harm. The second is a “benefit risk” where the CM’s function is to maximize the probability of an opportunity producing a beneficial outcome, such as achieving an objective.
Maintaining a safe environment requires analyzing and managing both types of risks. Keeping people safe requires managing or controlling a wide variety of threats from energy sources to exposure to infectious organisms and toxic substances. However, many safety risks are also associated with performing a task or executing a procedure trying to achieve an objective. These objectives include preventing cross contamination, working at heights to manage equipment or operate tools, transporting toxic compounds, operating equipment, etc.
Before applying the harm and benefit risk concepts using simple examples, an effective method for describing and communicating a risk’s probabilities as likelihood ratings is required.
Analyzing And Communicating Probabilities
Because estimating the probability that a future event will occur or not occur is essentially a belief, risk probabilities can be described as single-trial Bernoulli probabilities using a simple likelihood rating as shown in Table 1.
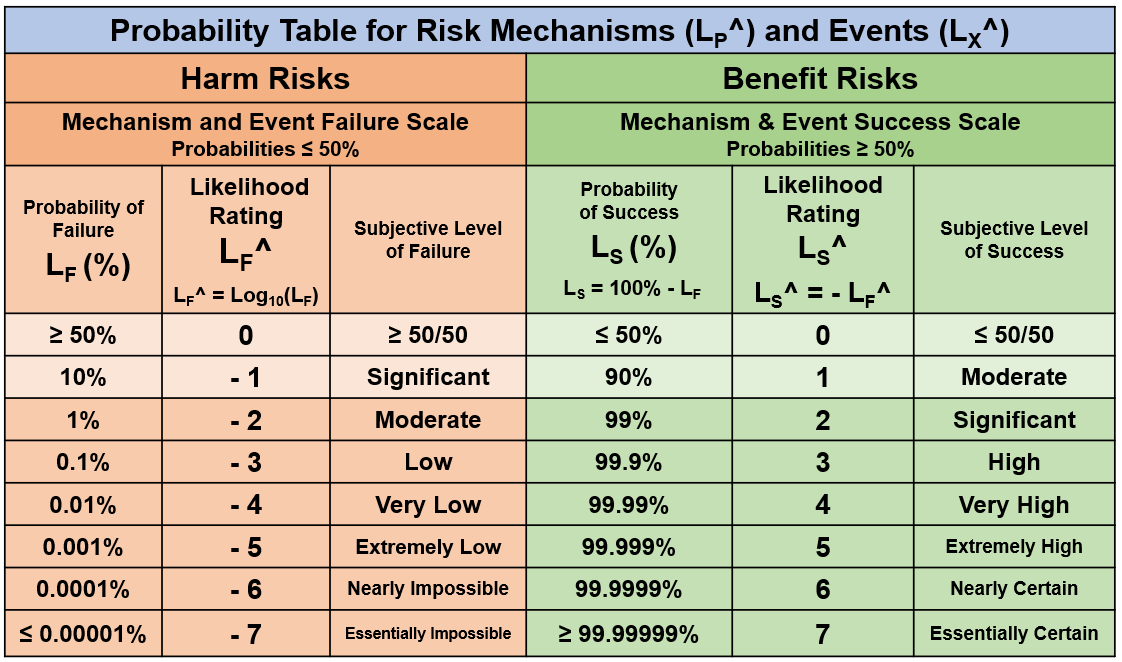
Table 1: Universal scales for efficiently and consistently describing a risk’s likelihoods of an event occurring or not occurring using a range from - 7 to + 7. The likelihood rating is a logarithmic order-of-magnitude (OoM) scale. The probabilities of an event resulting in success or failure follow the useful relationships LF + LS = 1 for probabilities or LF^ + LS^ = 0 for likelihood ratings. The derivation of the likelihood rating system can be found in reference 1.
Because a probability of a risk’s future outcome is just the analysis team’s belief based on their understanding of the evidence for making a binary ALARP yes/no decision, the OoM rating system shown in Table 1 is sufficient for analyzing risks.
The use of the OoM scale provides an unambiguous, concise, universal value that minimizes the likelihood of the team not effectively understanding and communicating their beliefs to reach a consensus. The approach is also effective for communicating with regulatory and management personnel who did not participate in the risk analysis.
An estimate of the probability of the risk’s outcome can be achieved by using several sources of evidence. One source is the frequency data for similar CM outcome risks that have comparable CMs and outcomes. A second is a scientific and engineering analysis by a team of experts familiar with how the CM functions for evaluating the CM’s future performance with respect to the probability of the CM producing the risk’s outcome.
Using CMEA essentially changes the way risks are viewed from bad outcomes to bad CMs that might produce bad outcomes using the modeling strategy shown in Figure 1. The goal of the risk analysis becomes one of estimating how likely a risk outcome will occur given the analysis team’s knowledge of the risk’s CM, including the team’s analysis of the CM’s input causal events and possible failure modes.
The simplest safety risks result from being exposed to a threat or hazard. This type of safety risk can be quickly understood using CMEA’s harm risk model.
Preventing Harm
If the subject is exposed to a threat or a hazard (defined as a constant or certain threat), an effective analysis model is a harm risk SRS that treats the CM as a protective barrier. A CMEA harm risk is described by a sequence of SRS element shown in Figure 2.
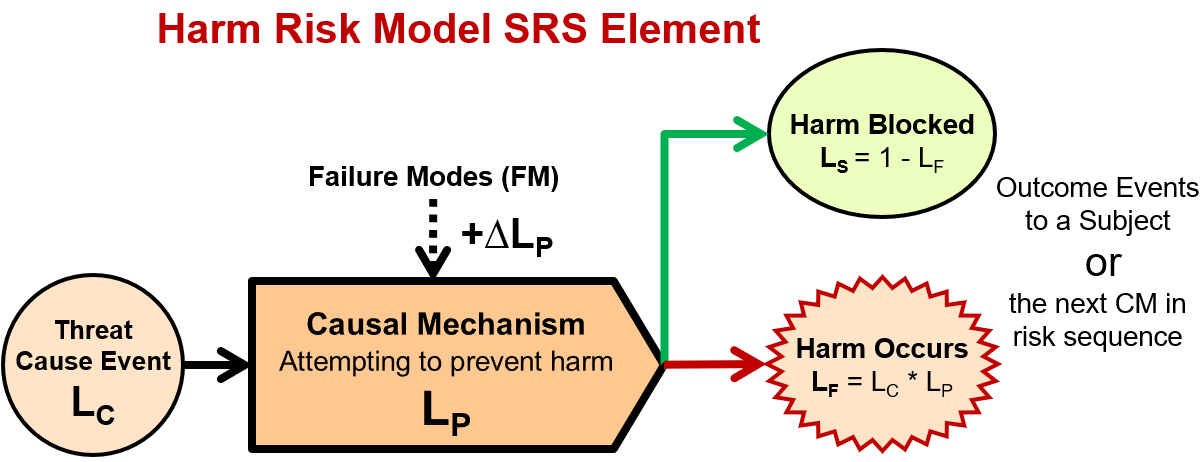
Figure 2: This shows the harm risk structure of the ReRA model shown in Figure 1 for preventing the occurrence of harm. A threat, possibly from a prior risk, of likelihood LC enters the CM that has a likelihood of LP of producing the harmful failure LF if the threat occurs. The likelihood of harm LF = LC * LP. The likelihood of preventing the harm is LS = 1 - LF. If the threat is a hazard (LC = 1), then LP = LF. Because the rating scale for LX < 50% is a logarithmic scale, LC^ + LP^ = LF^. Using the rating scale, LS^ = - LF^.
The element in Figure 2 can be used to model a sequence of protective barriers modeled as CMs for describing a risk from an initial threat cause event to a final harm event to a subject. As an example, the harm risk model can be used to model and analyze the flow of contaminants from a source through a sequence of containment barriers to result in contamination of product or operating personnel.3
The use of a harm risk element to build an SRS of a risk sequence can be demonstrated using a straightforward COVID-19 risk model shown in Figure 3.4
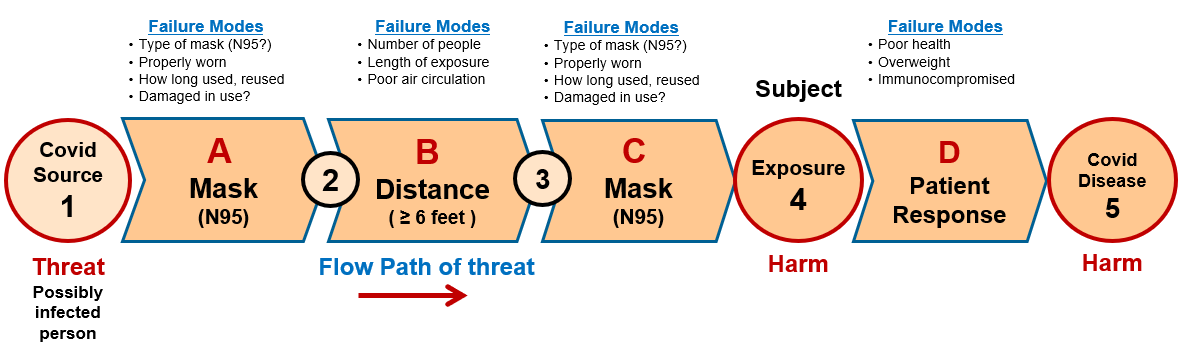
Figure 3: An SRS for the risk of being exposed to the COVID-19 virus by another person. The risk’s sequence is composed of elements described by Figure 2. The risk is initiated by threat #1 – the presence of someone possibly infected with a virus – that might flow through a series of three protective CM barriers to expose the subject at event #4. By convention, the CMs are lettered and events numbered. A second risk of the exposure resulting in disease is also shown in the SRS. A third risk (not shown) of likely significant interest to the subject might be dying from being exposed to COVID-19.4
Using a CMEA top-risk Bowtie analysis approach described in reference 1, the SRS shown in Figure 3 can be sequentially analyzed to estimate the probability of the COVID-19 exposure resulting from being around other people. The risk analysis can be expanded by adding CMs to estimate the probability of the exposure resulting in disease and then progressing to more serious outcomes. 4
The risk register shown in Table 2 summarizes the result of analyzing the SRS shown in Figure 3.
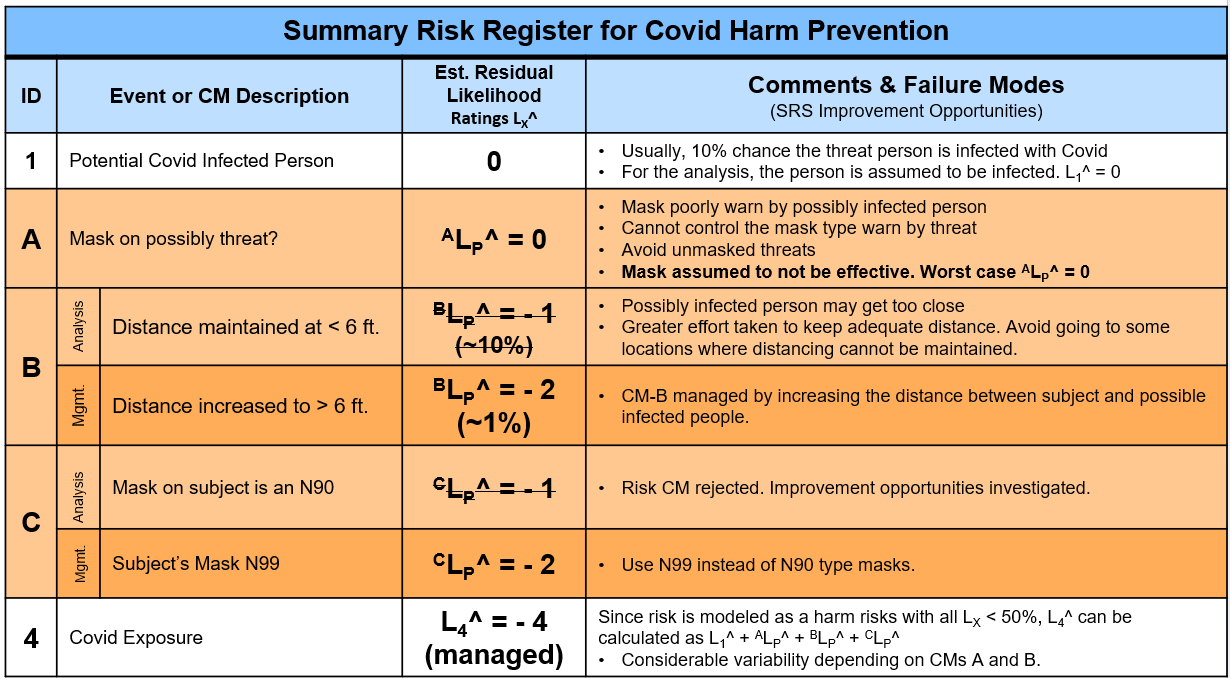
Table 2: Risk register for the COVID-19 harm risk example shown in Figure 3. An initial analysis of CMs B and C were unacceptable and subsequently managed to lower LP^s as described in the table. Managing the two CMs resulted in the exposure likelihood rating being significantly reduced from L4^ = - 2 (10e-2 or 1%) to - 4 (10e-4 or 0.01%).
Figure 3 shows two risks. The first is exposure risk (#1 – #4) described in Table 2. A second risk (#4 – #5) is shown in the SRS, but not further described in Table 2, is a risk of an exposure turning into COVID‑19 disease. A third risk of someone getting an active COVID-19 disease (#5) actually being seriously injured or killed by the infection could also be included to complete the primary concern of the subject.4
Many safety risks occur because someone is trying to accomplish an objective that requires exposing them to a hazard or threat.
Completing Tasks Safely – “Do It Safely”
The primary goal of a benefit risk approach is to follow the mantra “Do it safely.” Essentially, the risk analysis is a method of planning a task or activity so the individual has a high probability of safely achieving their objective. The ReRA model for a benefit risk is shown in Figure 4.
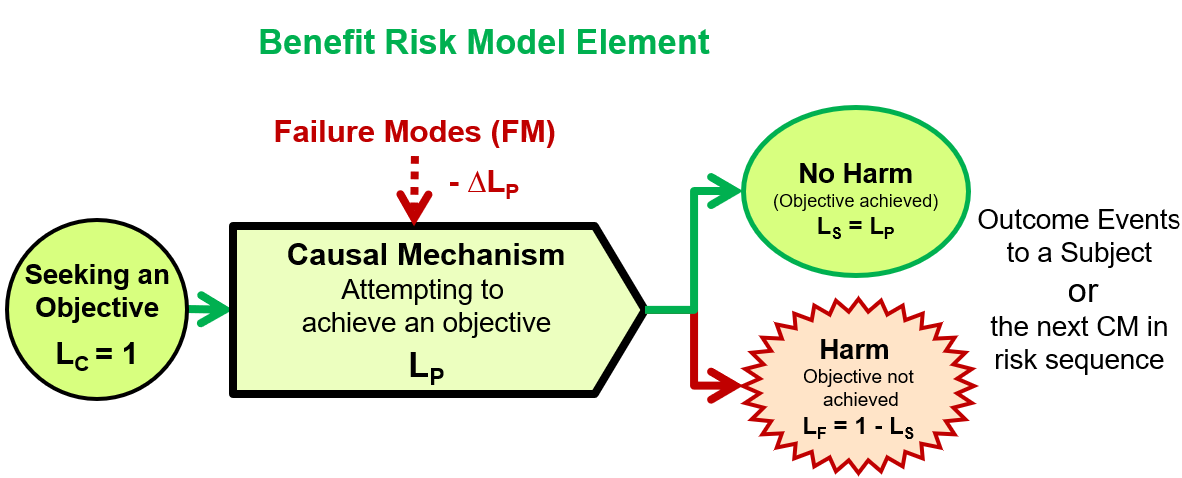
Figure 4: Benefit risk element for achieving an objective using the ReRA relationship shown in Figure 1. The goal of the analysis is for the activity achieving its objective safely by examining the causal mechanisms required to make sure each element has a high probability of success. The probability of achieving the objective LS is equal to LP given that LC = 1 (certain) because the risk is intentionally initiated. The likelihood of failure is thus LF = 1 - LS or LF^ = - LS^ if likelihood ratings are used.
The benefit risk model can be used to build SRSs for intuitively analyzing very simple tasks or, when appropriate, for planning and executing complex activities using a documented SRS analysis by a team of experts. The benefit risk is especially effective for analyzing procedures,5 managing supply chains,6 or executing projects.7
An example of a quick benefit risk analysis for a simple task that must be performed using a ladder is described by the SRS shown in Figure 5.
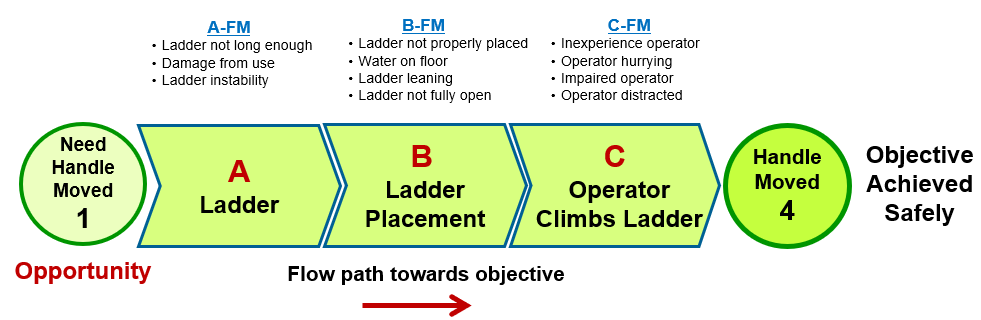
Figure 5: Simplified example for modeling a benefit risk SRS for throwing a valve handle that requires using a ladder to reach the valve. CM A is the ladder itself, B is how the ladder is placed for use, and C is how the operator uses the ladder. The success of safely achieving objective #4 requires the success of all three CMs.
With benefit risks, you are as safe as the weakest CM link in the chain. The success likelihood of a benefit risk sequences is approximated by using a benefit yield approximation that assumes that the overall rate of success for the entire sequence is defined as the minimum success rate in the risk’s CM sequence. Failure to make each CM ALARP makes the overall risk fail the ALARP criteria.
A risk register for the analysis of the SRS shown in Figure 5 is shown in Table 3.
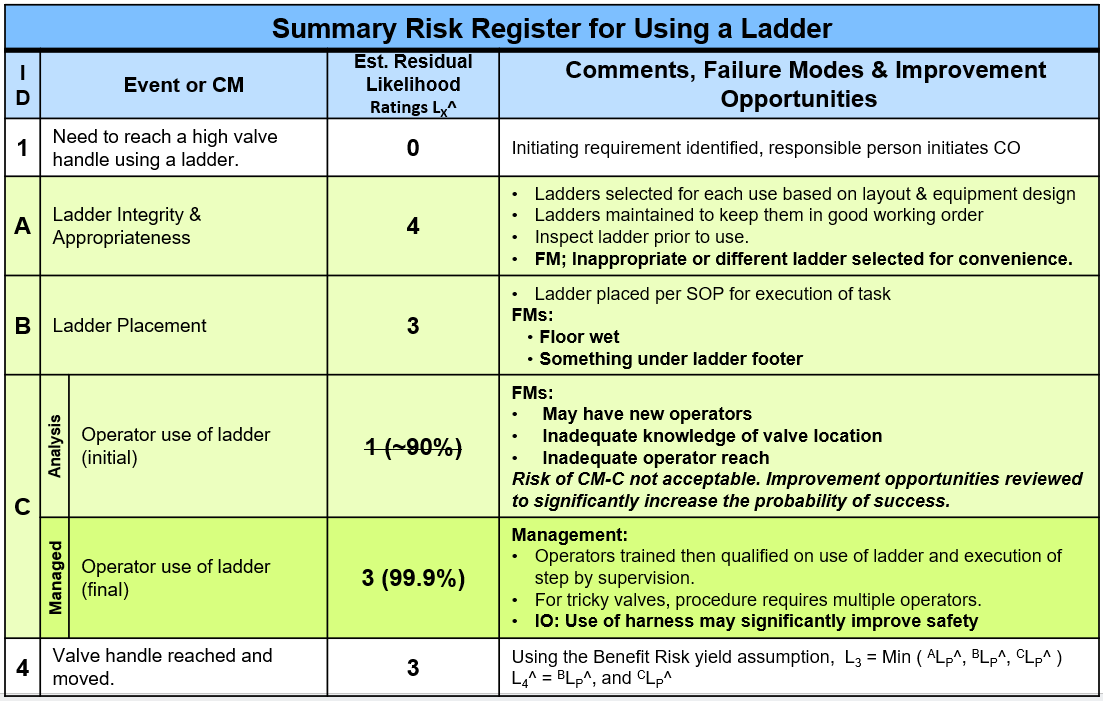
Table 3: Summary risk register for the risk of safely using the ladder described by the SRS shown in Figure 5. The RR includes management of CM C.
When analyzing the SRS, the third CM (C) was determined to not meet the ALARP criteria. CM C was managed by implementing additional controls to increase the likelihood of success increasing the task’s safety. If the operating height might result in severe safety concerns, additional improvement of the CMs, up to and including safety harnesses and other PPE for operating at heights, may be appropriate.
Summary
While simply estimating an acceptable probability of a safety event occurring may not be appropriate or justifiable, the use of the ALARP concept can be effectively used as a criterion for evaluating a causal mechanism’s ability to reduce its probability of producing a harm event to as low as reasonably practicable by identifying and controlling failure modes and implementing improvement opportunities.
One of the most important factors in maintaining a safe operating environment is being able to quickly and efficiently complete a risk analysis of tasks, activities, and actions that might result in harm before executing them. The CMEA-based approaches described can be done either using a formal risk analysis of activities covered by a procedure5 or intuitively by operating personnel before attempting to carry out an operating task. A CMEA mindset of “what you do matters” and “do it safely” should be an integral part of an enterprise’s safety culture.
References
- Witcher, M., Causal Mechanism And Effect Analysis (CMEA): FMEA’s Simpler, Effective Alternative, Pharmaceutical Online, May 1, 2026. https://www.pharmaceuticalonline.com/doc/causal-mechanism-and-effect-analysis-cmea-fmea-s-simpler-effective-alternative-0001
- Witcher, M., Relational Risk Analysis For The Bio/Pharma Industry, Bioprocess Online, January 29, 2024. https://www.bioprocessonline.com/doc/relational-risk-analysis-for-the-bio-pharma-industry-0001
- Witcher, M., Managing Contamination Risks In The Pharmaceutical And Medical Device Industries Using Relational Risk Analysis, BioProcess Online, February 18, 2025. https://www.bioprocessonline.com/doc/managing-contamination-risks-in-the-pharmaceutical-and-medical-device-industries-using-relational-risk-analysis-0001
- Witcher, M., Using System Risk Structures to Evaluate Covid-19 Pandemic Risks, BioProcess Online, May 2, 2022. https://www.bioprocessonline.com/doc/using-system-risk-structures-to-evaluate-covid-pandemic-risks-0001
- Witcher, M., Using Relational Risk Analysis To Control Procedure Failure In The Bio/Pharma & Medical Device Industries, BioProcess Online, February, 15, 2024. https://www.bioprocessonline.com/doc/managing-supply-chain-risks-using-relational-risk-analysis-0001
- Witcher, M., Managing Supply Chain Risk Using Relational Risk Analysis, Bioprocess Online, April 4, 2024. https://www.bioprocessonline.com/doc/managing-supply-chain-risks-using-relational-risk-analysis-0001
- Witcher, M., Analyzing And Managing CDMO Project Risks Using Causal Mechanism & Effect Analysis, Med Device Online, July 8, 2026. https://www.meddeviceonline.com/doc/analyzing-and-managing-cdmo-project-risks-using-causal-mechanism-effect-analysis-0001
About The Author:
 Mark F. Witcher, Ph.D., has over 35 years of experience in biopharmaceuticals. He currently consults with a few select companies. Previously, he worked for several engineering companies on feasibility and conceptual design studies for advanced biopharmaceutical manufacturing facilities. Witcher was an independent consultant in the biopharmaceutical industry for 15 years on operational issues related to: product and process development, strategic business development, clinical and commercial manufacturing, tech transfer, and facility design. He also taught courses on process validation for ISPE. He was previously the SVP of manufacturing operations for Covance Biotechnology Services, where he was responsible for the design, construction, start-up, and operation of their $50-million contract manufacturing facility. Prior to joining Covance, Witcher was VP of manufacturing at Amgen. You can reach him at witchermf@aol.com or on LinkedIn (linkedin.com/in/mark-witcher).