
An Analysis Of FDA's 2017 Enforcement Action Statistics
By Barbara Unger, Unger Consulting Inc.
 FDA recently published its enforcement statistics for FY2017, a practice that started with the publication of FY2009 data. The metrics provide a high-level overview of enforcement actions — including injunctions, seizures, warning letters, and recalls — conducted by all FDA Centers. This posting will look at data from the enforcement metrics in two ways:
- First, we will address the data presented in the FDA FY2017 slide deck. These data represent all centers of the FDA: Center for Drug Evaluation and Research (CDER), Center for Biologic Evaluation and Research (CBER), Center for Devices and Radiologic Health (CDRH), Center for Veterinary medicine (CVM), Center for Food Safety and Nutrition (CFSAN) and Center for Tobacco Products (CTP).
- Second, we’ve developed additional graphs from data in FDA enforcement metrics published between 2008 through 2017 that address only CDRH enforcement actions. We evaluate trends over the entire interval for a selected set of actions for CDRH. The figures in this section of the article are not published in the FDA metrics although the data come from those metrics.
- Conclusions based on FDA FY2017 Enforcement Metrics: Each conclusion references the slide number(s) in the FDA deck.
- Three product seizures occurred in FY2017, down from four in FY2016, and down from a high of 15 in FY2011. Except for an increase in 2016, the number of seizures has decreased consistently since 2011. This year, CFSAN requested two of the seizures, and CDER requested one seizure. (FDA Slides 2 and 3)
- FDA Injunctions decreased from a high of 21 in FY2015 to 12 in FY2017. CDER is the most active Center this year, with 6 of the 12 injunctions associated with firms whose products they regulate. CFSAN was associated with five injunctions and CVM with 1. CDRH, CBER, and CTP had none. (FDA Slides 4 and 5)
- The total number of warning letters from all Centers decreased from 17,232 in FY2015 to 14,590 in FY2016, yet rose to 15,318 in FY2017. The Center for Tobacco products issued 97 percent of the warning letters this year, continuing to be the dominant player here. This year, warning letters are distributed as follows: CTP (14,875), CFSAN (199), CDER (161), CDRH (42), CVM (35), and CBER (6). Note that these data include all warning letters, and not just those issued for GMP deficiencies. (FDA Slides 6 and 7)
- CDRH had the highest number of total recall events in FY2017, as it did last year, with 1,068, followed by CFSAN (794), CBER (669), CDER (348), CVM (65), and CTP (1). These values include all recall events classifications. (FDA Slide 8)
- CFSAN had the highest number of recalled products in FY2017, tallying 3,609, followed by CDRH (3,226), CDER (1,176) CBER (900), CVM (285), and CTP (3). These values include all recall classifications. (FDA Slide 9)
- For all Centers and all recall classifications, the total number of recalled products increased from 8,305 in FY2016 to 9,199 in FY2017. The average number of recalled products over the past six years — beginning in FY2012 — is 8,709, with a high of 9,469 in 2012 and a low of 8,044 in 2013. (FDA slide 10)
- CFSAN led FY2017 in the number of Class I recalled products (1,257), followed by CDER (75), CDRH (64), and CVM (51). Neither CBER nor CTP conducted class I recalls in FY2017. (FDA Slide 12)
- CDRH led FY2017 in the number of Class II recalled products (3,078), followed by CFSAN (2,112), CDER (908), CBER (607), and CVM (228). (FDA Slide 13)
- CBER led FY2017 in the number of Class III recalled products (293), followed by CFSAN (240), CDER (193), CDRH (84) and CVM (6). (FDA Slide 14)
- Conclusions Based on FDA Data from FY2008 through FY2017 for CDRH.
Data used to construct the Figures 1 through 5 below are taken directly from the FDA slide decks of enforcement actions from 2008 through 2017. The figures do not, however, appear in the FDA slide decks. All data are in fiscal years (FY).
Fig. 1 shows the combined number of CDRH product seizures and injunctions, which varied between 0 and 2. CDRH had no injunctions or seizures in 2009, 2014, and 2017.
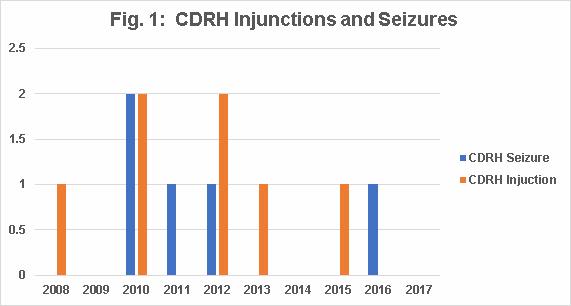
Fig. 2 shows that warning letters issued by CDRH increased slightly between 2010 and 2013 (with a dip in 2011), followed by a dramatic decrease in FY2014, another increase in 2015, and decreases again in 2016 and 2017. Please note that these data do not exclusively represent GMP warning letters, but include all warning letters issued by CDRH. The decrease in 2017 also reflects the decrease in warning letters for advertising, which have all but disappeared.
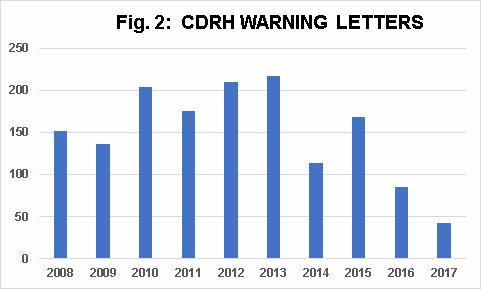
Fig. 3 shows that CDRH’s average number of recall events between 2008 and 2017 is 1,080, and ranges in value between 776 and 1,283. The number of CDRH-recalled products averaged 2,709, with a range in value between 2,304 and 3,226.
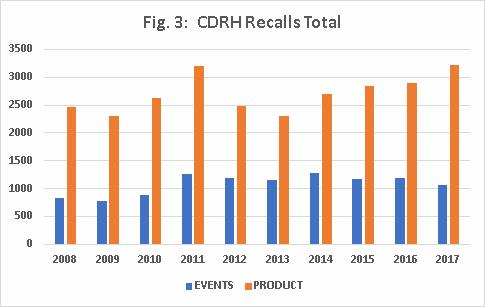
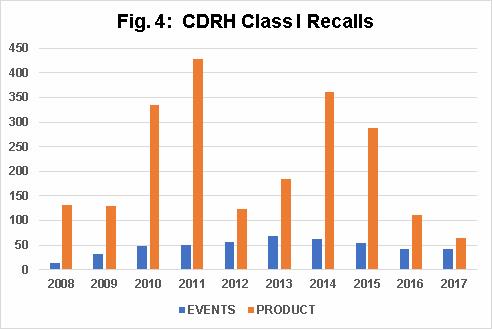
Fig. 4 shows the number of CDRH Class I recall events per fiscal year between 2010 and 2017 has consistently hovered around 50. It also shows that the number of CDRH Class I products recalls increased from 2009 through 2011, decreased precipitously in 2012, increased again in 2013 and 2014, and then continued to decrease through 2017.
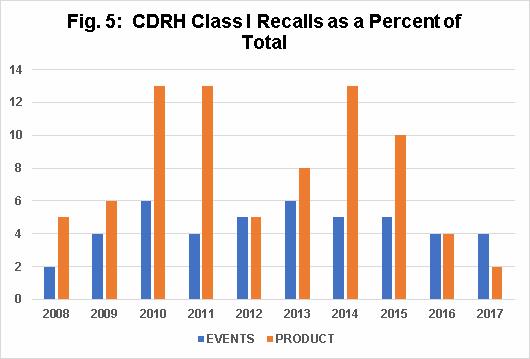
The question often arises whether Class I recalls as a percentage of total recalls is increasing over time. When considering CDRH Class I recall events as a percentage of the total of CDRH recall events, Fig. 5 shows that values remain consistent between 4 percent and 6 percent, with a low of 2 percent in 2008.
For CDRH Class I recall products as a percentage of total CDRH-recalled products, the values increase between 2008 and 2011, and then decrease by approximately half in 2012. From 2012 through 2014, they increase again to the levels of 2010 and 2011, but then decrease in 2015, 2016, and 2017. This variability may simply represent normal fluctuations, given the small numbers, but it is something we will monitor in the future.
It’s always interesting to use the past as a roadmap for the future. This year, with the new administration in the White House, it is a bit more complicated. The current administration has worked to diminish regulations, but its approach to enforcement actions remains unclear.
Time will tell; it will be a wait-and-see situation, and enforcement trends may continue as they did in 2017. Stay tuned — we will monitor these trends and let you know what we see, read, and ultimately find in the FY2018 enforcement metrics.
About the Author:
 Barbara Unger formed Unger Consulting, Inc. in December 2014 to provide GMP auditing and regulatory intelligence services to the pharmaceutical industry, including auditing and remediation in the area of data management and data integrity. Her auditing experience includes leadership of the Amgen corporate GMP audit group for APIs and quality systems. She also developed, implemented, and maintained the GMP regulatory intelligence program for eight years at Amgen. This included surveillance, analysis, and communication of GMP related legislation, regulations, guidance, and industry compliance enforcement trends. Barbara was the first chairperson of the Rx-360 Monitoring and Reporting work group (2009 to 2014) that summarized and published relevant GMP and supply chain related laws, regulations, and guidance. She also served as the chairperson of the Midwest Discussion Group GMP-Intelligence sub-group from 2010 to 2014. Barbara is currently the co-lead of the Rx-360 Data Integrity Working Group.
Before Amgen, Barbara worked for the consulting firm Don Hill and Associates, providing regulatory and quality services to the pharmaceutical industry, and for Eli Lilly and Company in quality and CMC regulatory affairs positions. She began her career in the pharmaceutical / device industry with Hybritech Inc. and received a bachelor's degree in chemistry from the University of Illinois at Urbana-Champaign. You can contact Barbara at bwunger123@gmail.com.