
Drug Delivery Systems: Measurement System Analysis Using Continuous Gage R&R Studies, Part 1
By Allan Marinelli and Howard Mann

All drug delivery manufacturing systems that undergo quality improvement projects to reduce the defect level while improving the response time for correction(s) involve teams, or an assigned group of stakeholders, to gather as many potential inputs that are intrinsic to the system in question and subsequently analyze the data to arrive at the most plausible solution(s) that constitutes the intent and elements on designing continuous Gage R&R studies.
In attempting to decipher the potential variants involving the measurement system — and despite the fact that using tools/methods such as gage repeatability and reproducibility (GR&R) may appear to be a waste of time from a time management perspective — a GR&R study serves as a critical tool for understanding the capabilities of a system that is applicable to combination products/devices, parts, or items.
In this article, which is part 1 of three, we will dive into the use of the theoretical/process understanding (practical process/manufacturing applications) and discuss potential sources of overall variations from the total measurement system prior to designing a continuous (variable) GR&R study.
In part 2, we will examine the following topics with respect to designing a continuous GR&R study protocol:
- prior to designing the study protocol (prerequisites) phase,
- development and approval of the study protocol phase,
- execution of the study protocol phase (execution sequence), and
- post-execution of the study protocol phase.
In part 3, we will discuss a generic case study example of continuous (variable) GR&R using Mini-tab pertaining to:
- an overview of interpreting the setup and how the data are connected,
- the role of the study director in how the measurement system analysis is set up and configured, including its parameters,
- data entries,
- analysis phase, and
- an optional step for data compilation.
A Theoretical Understanding
Measurement System Analysis For Continuous Data
The intent of a continuous data measurement system in a manufacturing situation is to collect the right data that represents the actual manufacturing conditions, including inherent effects on both process and measurement variations that are derived from the following:
- The “operator” or “appraiser” — The abilities and capabilities of the operator or appraiser based on their level of skills. Training history would either increase or decrease the potential variability.
- The “gage/device” — which entails calibration (The inherent level of accuracy of the gage to measure the output compared to the known master or standard device/item/part at question) and stability (does the gage itself change the measurement output as a function of time?).
- Discrimination or resolution — which can be defined as the smallest division on a gage scale. As an example, if the gage is sensitive enough to measure an output device/item/part to a decimal degree, then the gage itself can be classified as sensitive enough to measure the device/part/item to a reasonable discrimination or resolution level.
- Repeatability — which refers to variation that is attributable upon measuring a device while factoring in the same operator or appraiser (intraoperator variation) conducting measurements against the same known master/standard device/item/part for every trial assessed.
- Reproducibility — which refers to variation that is attributable upon measuring a device while factoring in the interoperator variation (e.g: variations attributed amongst the three operators performing the repeated measurement per trial relative to the provided known/standard devices/items/parts.
- Linearity1 — describes the consistency of bias over the operating range of a measuring device. For example, if a bathroom scale is off by 1.0 pound when measuring a 150-pound person but is off by 5.0 pounds when measuring a 200-pound person, then its bias is nonlinear in the sense that the degree of bias changes over the range of use.
- Bias — also referred to as the accuracy in which the distance between the average values of the conducted measurements performed by the operators/appraisers compared to the “true”/“actual” values or the known master standard device/part/item outputs at question.
- Sample variation within — which is variation within a sample. It is part of process variation that is often in combination with a measurement variation.
Figure 1: Potential sources of process variation

Gage R&R
To confirm the validity and reliability of your continuous (variable) data measurement system, you use a continuous (variable) GR&R tool that is part of your test method validation (TMV) protocol to conduct an audit, benchmark, baseline program or as part of your initial and ongoing validation program.
This entails using multiple people (appraisers), multiple items/parts, and multiple measurements. Each person measures every item at least twice (trials).
Therefore, the GR&R data determines the following:
- percentage overall agreement (% repeatability & reproducibility),
- percentage agreement within individuals (% repeatability, agreement with themselves),
- percentage agreement between individuals (% reproducibility, agreement with others), and
- the effective error in measurements, including tolerances derived from the instruments/devices used to conduct the measurement to obtain a data output.
Gage R&R Vs. Calibration
A GR&R study examines the whole continuous data measurement system, including the test samples, people, techniques, and methods. Many people confuse a GR&R study with tool calibration, but the two are different. Calibration considers only the reading and comparison to a known standard without factoring in the other potential errors in measurement, as shown in Figure 1. Gage R&R is significantly different and often far more difficult. It analyzes the entire variation within the measurement system.
Total Process Variation
The total process variation comes from the true process variation and the continuous data measurement system.
Total Variation = Process Variation + Measurement Variation
Or in statistical terms:
σ2Total = σ2Process + σ2Measurement
Figure 2: Total Variation Representation

To effectively understand the process variation, the variability due to the measurement system needs to be small.
Gage R&R determines:
- the size of the measurement error,
- the sources of measurement error,
- whether the measurement system is stable over time,
- whether the measurement system can measure the process or product to reflect the quality output of the product,
- where in the measurement system to focus improvement, and
- repeatability.
The GR&R study breaks the total observed measured continuous data variation into two components – repeatability and reproducibility:
σ2MS = σ2Repeatability + σ2Reproducibility
Where σ2 is (variance of the population)
Repeatability variation occurs when repeated measurements are made of the same variable under identical conditions. It is the variation between successive measurements of the same sample/part/item, of the same characteristic/attribute in question that is performed by the same person (appraiser, operator) using the same instrument.
Poor repeatability causes an increase in decision error. When the same person looks at the same characteristic and measures different values during the second or third trials, that makes results questionable.
Note: Poor repeatability shows that the data derived by an appraiser is way off and demonstrates large variation compared to the actual known reference/master value, as shown below. Conversely, good repeatability is closer to the actual known reference/master value, with less variation from the mean.
Figure 3: Good Repeatability versus Bad Repeatability to Master Value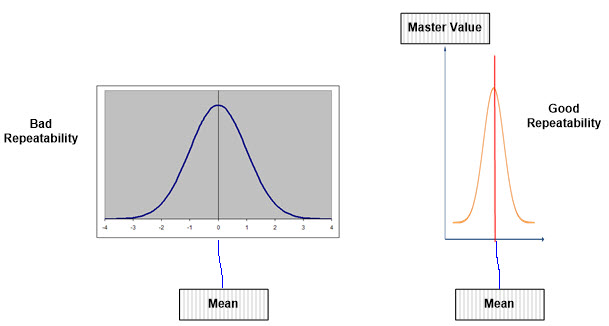
Reproducibility
Reproducibility variation comes from different people making measurements on the same items/parts/products using the same instrument. We examine this variation under different conditions such as time, environment, temperature, work conditions, etc. When two or more individuals return the same value for a given characteristic/attribute of interest, that measure is determined to be reproducible.
Figure 4: Good Reproducibility versus Bad Reproducibility to Master Value

P/T Ratio
The P/T ratio compares the size of the continuous data measurement system error with respect to the size of the specification. Since all measurement systems have variation, this metric lets you know if your measurement system variation is acceptable (or minimal) to measure a characteristic.
% P/T = 5.15 x σ2 MS X 100
Tolerance
The P/T ratio represents the percent of the specification tolerance taken up by measurement error. The metric includes both repeatability and reproducibility. An excellent continuous data measurement system has a P/T ratio of less than 10%. A value of 30% is barely acceptable.
Standard Deviation
A standard deviation of 5.15 accounts for 99% of measurement system variation. The use of 5.15 is an industry standard that many companies use, but more recently some companies recommend the use of 6 standard deviations, which represents 99.73% of measurement system variation. Either value is appropriate provided that you use it consistently across your operation.
%R&R
If you're measuring process improvement without a specified tolerance, it is recommended that you use a more appropriate metric of %R&R. This represents the percentage of the total process variation taken by the measurement error:
%R&R = σ MS X 100
σ Total
An excellent measurement system has a %R&R of less than 10%. A value of 30% is barely acceptable.
Discrimination
Discrimination (sometimes called resolution) represents the number of decimal places that can be measured by the system. Increments of measure should be about one-tenth of the width of the product specification or process variation.
Interpreting MSA Statistical Process Control (SPC) Output Charts
The SPC range chart should show a process is in a state of control. Repeatability is questionable if the range chart shows out-of-control conditions. As an example, if a point is above the upper control limit (UCL) or below the lower control limit (LCL), the operator is having a problem making consistent measurements. If the range chart for an operator is out of control and the other charts are not, then the method is probably suspect. If all operators have ranges out of control, the system is sensitive to operator technique.
The range chart also helps identify inadequate discrimination. There should be at least five distinct levels (points along the Y axis) within the control limits. Also, if more than a quarter of the values are zero, again, measurement discrimination is suspect.
For the operator SPC Xbar chart, the plot represents the average reading of each item measured. Due to part-to-part variation, most of the points on the chart should fall outside the control limits. In addition, the chart's pattern needs to be consistent for all the operators. If not, then the reproducibility is suspect. If you see no points outside the control limits, then the selected samples did not cover the full range of the process (i.e., there was not enough part-to-part variation).
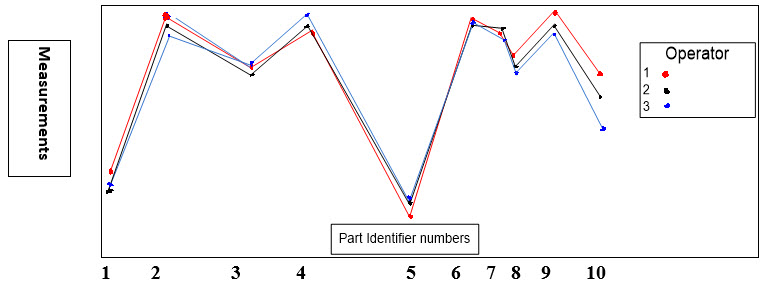
An Example of GR&R Operator–Part Interaction Plot
Below (Figure 5) is an example of an operator-part interaction plot. For a reliable continuous data measurement system, the lines should follow the same pattern and be reasonably parallel to each other or close enough. Crossing lines between operators indicate significant interactions. Furthermore, the part averages (Shown as Part Identifier numbers) should vary enough that the differences between parts are clear.
Figure 5: GR&R Operator–Part Interaction Plot
An Example of a Gage R&R By Operator Plot
Below is an example (Figure 6) of a GR&R by operator plot, which shows the average value (circle) and the spread of the continuous data for each operator. The spread should be similar across all operators, and it can be expected that a flat line across the means of the operators delineates good congruence.
Figure 6: Gage R&R By Operator Plot

Interpreting The Output Charts
Table 1: Interpretation of Output Charts. Note that the data transcribed in the table is for illustrational purposes only by merely conveying the relevance and intent on interpreting the “Key Data Metrics to Focus.”
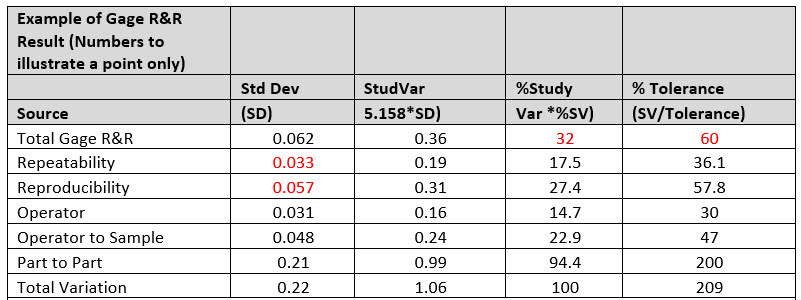
Number of Distinct Categories = 4
The Key Data Metrics To Focus On:
- The P/T ratio (listed as the %Tolerance) is shown to be 60%. This indicated that the gage is clearly not reliable to use since the acceptable production gage is up to 30%.
- The %R&R (listed as %Study Variation) is shown at 32%. This gage is less than acceptable since the acceptance criteria for an acceptable gage as aforementioned is 30%. This metric substantiates that improvements are needed to be deployed to your current manufacturing processes.
- From the data, it is shown that a large portion of the existent variation comes from reproducibility source as delineated from its standard deviation (0.057) versus repeatability (0.033), which proves that appraisers don’t agree with one another or that they are incongruent.
- The largest variability impact from the reproducibility source comes from an operator–sample interaction. In some way, due to the items measured characteristic, the operators measure different samples differently. This could occur when one or more appraisers aren't good with small parts but can adequately measure larger parts, while others can measure all samples equally well.
- The number of distinct categories is an indication of the discrimination of the measurement system. If the number of categories is less than five, the measurement system is of minimal value because it is difficult to distinguish one entity from another.
Variable Gage R&R Guidelines
The guidelines for acceptable or unacceptable measurement systems can vary depending on an organization’s tolerance or acceptance criteria based on your manufacturing intent.
A common guideline that is often used in many industries was published by the Automotive Industry Action Group and known as the AIAG Standard use.
However, due to the unnecessary restrictions of the acceptance criteria specified within the AIAG standard in which the user would quickly conclude that your measurement system is either acceptable to not acceptable, quality control expert and statistician Dr. Donald Wheeler has a more realistic interpretation approach whereby delineating four categories of your measurement system on how much the measurement system reduces the strength of a signal, the chance of the measurement system detecting a large shift in the data, and the ability of the measurement system to track process improvements. This is derived by four categories below.
- First class monitors
- Second class monitors
- Third class monitors
- Fourth class monitors
NOTE: Further discussion of Wheeler’s approach is outside the scope of this article, but users are highly encouraged to also factor in his approach toward reaching a final conclusion of your measurement system.
Conclusion
Once you acquire a theoretical/practical understanding of the uses and pertinence of continuous (variable) GR&R studies in a measurement system analysis, you can then attempt to decipher the elements needed to design a continuous/variable GR&R study. This will be discussed further in Part 2 and followed in Part 3 by an actual hands-on case study using Minitab statistical data analysis software.
Reference
1. eBook: Drug-Delivery Devices — Measurement-System Analysis Using Gauge R&R Studies by Allan Marinelli, Howard Mann with Cheryl Scott on Wednesday, September 28, 2022
About The Authors:
 Allan Marinelli is the president of Quality Validation 360 and has more than 25 years of experience within the pharmaceutical, medical device (Class 3), vaccine, and food/beverage industries. His cGMP experience has cultivated expertise in quality assurance, compliance, quality systems, quality engineering, remediation and validation roles controlled under FDA, EMA, and international regulations. His experience includes quality systems, CAPA, change control, QA deviation, equipment, process, cleaning, and computer validation, as well as quality assurance management, project management, and strategies using the ASTM-E2500, GAMP 5, and ICH Q9 approaches. Marinelli has contributed to ISPE baseline GAMP and engineering manuals.
Howard Mann works as an independent consultant and/or contractor in the operational, regulatory, and quality assurance arenas. He has extensive experience in the healthcare industry and provides technical leadership guidance to the business development process, including the product development process in all areas of GxP compliance.