
New ways of thinking about cleanroom airflow design - Part 2
Proposing a simpler, more rational model for airflow design
Part two of a two-part article. Click here for Part 1.
By Rajan Jaisinghani
Bio Plus® Filters-Technovation Systems Inc.
The most significant factor affecting both the initial and operating costs of cleanrooms is airflow. As industries and markets grow more competitive—and as the unarguable edict of energy conservation becomes widely accepted in all industries—it is necessary to re-evaluate existing methods of airflow design, and as part of that review, to consider new ways of thinking about air handling and the efficacy of newer methods.
None of these trends are apparent in the airflow charts used by most cleanroom designers. Although this model is simplified, it nevertheless provides a rational guide for designing airflow when the air distribution in the cleanroom is as close to ideal as possible. In fact, by using a computational scheme that moves from one small elemental volume to another, it is possible to use this simplified method for designing cleanrooms.
Turbulent re-entrainment, diffusion, and convection
It is important to bear in mind that the above dilution model is valid for a well distributed airflow cleanroom, with no re-entrainment. Re-entrainment can be due to turbulence and convection due to gradients in room pressure. These gradients are typically a result of poor airflow distribution through the ceiling. At flow rates normally used in cleanrooms it is unlikely that particle diffusion plays a role in the re-entrainment process, except in zones of very low velocity.
Many cleanroom standards or guidelines call for 90 fpm velocity through ceiling HEPA filters. There is simply no basis for this. Recent work conducted at Sematech,3 MIT45 shows that 90 fpm flow velocity is too high and can, in fact, lead to turbulent re-entrainment. Most of these researchers have recommended that the maximum velocity for a well distributed ceiling discharge should not exceed about 65 fpm.
To precisely design for minimal turbulence and re-entrainment, finite element or finite difference analysis methods are typically used to solve the Navier-Stokes fluid mechanics equations. It is beyond the scope of this article to describe those methods here. However, it should be sufficient to state here that such methods typically require personnel with significant training and experience in numerical fluid mechanics (computational fluid dynamics) to produce accurate results.
Airflow distribution is probably the most important aspect of airflow design in cleanrooms. Unfortunately, not enough attention has been paid to this matter, and instead a great deal of emphasis has been placed on invalid criteria such as 90 fpm filter velocity.
One of the most commonly used filter systems, the Fan Filter Unit (FFU), basically puts quantum packets of flow in a 2 x 4 ft. space. (It should be noted, however, that FFUs may be used along with "membrane" ceilings to accomplish better airflow distribution.) In such cases the cleanroom airflow is not always well distributed, therefore the room typically may require higher flow rates to achieve the required classification. This is because a system with a well distributed airflow will outperform a system that inputs the same amount of airflow in a smaller percentage of the room cross section.
Compared to FFUs, a filtration system that allows higher levels of ceiling coverage with a centralized fan distributing a correctly designed airflow rate is more efficient. Such systems, with in-duct filters, can be significantly cost effective, especially if the requirement for having terminal filters is removed for Class 1000 and higher cleanrooms. There is no fundamental reason to require terminal filters for such higher class rooms if proper and minimal duct work is used between the in duct filters and the point of discharge.
In the absence of re-entrainment and with proper airflow distribution, low airflow velocity (e.g., 10-20 fpm) can easily sweep off or transport generated particles out of the room. The mobility of submicron particles due to diffusion mechanisms is still much lower than the convection mobility at such low flow rates. Higher velocities will have higher convectional transport of such particles- but these differences may not always be significant in the time frame of the cleanroom processes. The residence time, Tr, in the above elemental volume is given by:
Tr= Volume/Flow Rate = 1/Q (4)
Thus, at 20 fpm the residence time will be 3 sec.: at 40 fpm, it will be 1.5 sec., and at 60 fpm, it will be ~ 1 sec. Left to be determined is the probability of whether the existence of the particle for this time frame, within this volume, will have a detrimental effect on the product. The abovementioned turbulence and particle transport studies 3-5, show that the gain in lower convection residence time at velocities higher than about 65 fpm do not result in lower actual residence time. This is due to turbulent re-entrainment as a result of eddy formation.
This paper has shown that more analysis is required for energy and cost efficient cleanroom airflow design. Computational fluid dynamics, coupled with particle trajectory calculations, is the best method for cleanroom design. However, as previously discussed, such methods have a higher difficulty level associated with them. Another method is to use the solution to the average particle-material balance differential equation2, using a value of G (which is closer to the value for the dirtiest portion of the room) and to compute the room recovery rate.
Figure D shows a typical result: the speed at which a room cleans up after being initially contaminated. This is an important design parameter, since there is always periodic step ingression of contamination into the room (e.g., from material or personnel influx) apart from the continuous ingression from make-up air and other process sources. The lower (i.e., cleaner) the class of cleanroom, the faster it should recover to its classification. Keep in mind that the ordinate shows the spatial average concentration and that there will be a local variation about this space average.
This method has been used extensively at Technovation in design/build projects, with some experience-based factors that relate the special averages to the peak concentrations (or distribution). It is beyond the scope of this paper, however, to provide a detailed description of the techniques used in such a method.
References
For more information: Rajan Jaisinghani, Technovation, 13511 East Boundary Rd., Suites D/E, Midlothian, VA 23112-3941. Tel: 804-744-0604. Fax: 804-744-0677.
Read Part 1 of this two-part article.
Edited by Angelo DePalma,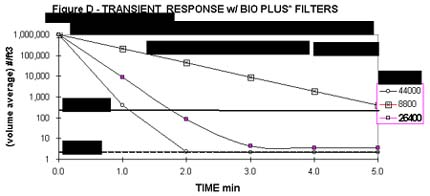
Managing Editor, Pharmaceutical Online