
Reimagining HACCP And Other Process Flow Risk Analysis Methods Using Relational Risk Analysis
By Mark F. Witcher, Ph.D., biopharma operations subject matter expert

HACCP (hazard analysis and critical control point) is a risk analysis method used in the food and pharmaceutical industries for controlling contamination and other operational risks.1,2,3,4 This article explains how ReRA’s (relational risk analysis) modeling strategies can be combined with HACCP and other process flow diagram (PFD) methods such as HAZOP,5 PHA, 6 FTA,7 etc., to transform these methods into mechanism-centric approaches, potentially making them more efficient and effective for analyzing and managing pharmaceutical, biopharmaceutical, and medical device risks.
Because risks are currently defined as events by ISO and ICH, most of the current risk analysis methods largely focus on defining and thus analyzing risks by their events.8,9 Since nothing happens spontaneously, every harm consequence or objective benefit is produced by some kind of “process” that is initiated by one or more prior events. Thus, every outcome risk event results from one or more combinations of actions and activities produced by people, procedures, methods, equipment, instruments, processes, systems, or anything else that can be described, analyzed, and managed as part of a risk mechanism.10 As a result, the uncertainty of every outcome comes exclusively from the uncertainty of the mechanism that produces it.
PFD methods have both strengths and weaknesses. Their strengths include viewing and modeling risks as the flow of outcome events through processes, control systems, and mechanisms that propagate or prevent their outcome events from occurring. In addition, HACCP’s use of critical control points (CCPs) is especially useful for modeling and managing many risks.
However, the methods do not include a strategy for quantitatively analyzing the mechanism’s ability to estimate the probability of the outcome events they produce. In addition, the PFD methods do not include the ability to clearly identify and quantitatively include the impact of various failure modes or improvement opportunities that might affect the probability rate of failure or success of the mechanisms.
Both realizing a preventable harm event or failing to achieve an attempted benefit are risk outcomes. In order to best analyze and manage many important risk mechanisms such as procedures11 and supply chains,12 a risk analysis method must be able to handle achieving benefits as well as preventing harm. HACCP’s second weakness is that it does not provide an approach for analyzing and managing opportunities for achieving the benefit of reaching an objective.
HACCP also leans heavily on monitoring control points. While monitoring is important to assure the mechanism’s performance, the focus of risk management should be on prospectively designing and operating processes to provide a high degree of assurance that the acceptance criteria established for each CCP, including final outcomes, are achieved.
ReRA’s modeling strategies can be used to deal with these and other limitations.
ReRA Strategies For Modeling Risks
ReRA views risks as probabilistic relationships between events and risk mechanisms. Current risk analysis methods focus on either the cause or outcome events. However, ReRA focuses the analysis on the role of the connecting process, control system, or mechanism as the central feature for both analyzing and managing risks.
As shown in Figure 1, a simple risk is defined as a cause – mechanism – outcome relationship using single-trial Bernoulli probabilities (P) of an outcome of either a harm or benefit event occurring as the result of a cause event according to the relationship:
P(cause) * P(mechanism) = P(outcome) or LC * LP = LH or B
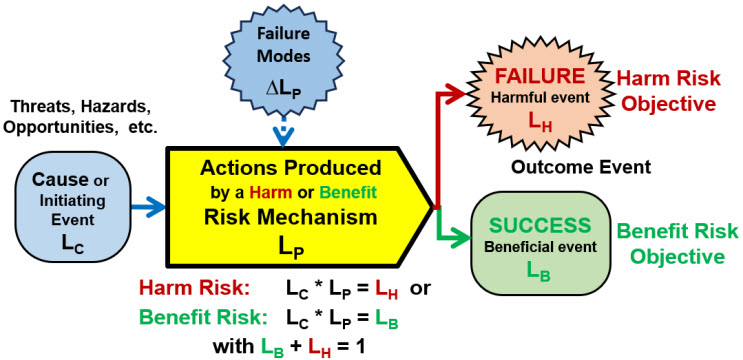
Figure 1: ReRA basic element for describing either a simple harm or benefit risk. The likelihoods, expressed as a single-trial Bernoulli probability, of the risk’s outcome of a benefit LB or a harm LH is the mathematical product of the likelihood LC of the cause or initiating event occurring and the mechanism’s likelihood LP of propagating the cause to produce the harm or benefit outcome. Thus, for a harm risk LH = LP * LC with LB = 1 – LH and, for a benefit risk, LB = LP * LC with LH = 1 – LB.
Accordingly, risks must be divided into two fundamentally different types based on their objective. The mechanism either minimizes or maximizes the probability of the appropriate outcome event. Thus, for a harm risk mechanism this is LC * LP = LH or for a benefit risk mechanism, LC * LP = LB. The goal of both types of risks is to maximize the probability of success LB and minimize the probability of failure LH.
A risk mechanism has two different inputs with differing impacts on modeling the probability of the outcome event occurring. The first input is the cause event of probability LC that initiates the mechanism for producing the outcome event. If the cause does not occur, that is, LC = 0, the outcome event cannot occur.
Many benefit risks, such as a procedure or supply chain, are deliberately initiated, thus LC = 1. The cause of some harm risks, such as a dangerous cliff or high energy source means that the initiating cause is also certain, LC = 1. Thus, for many risks LP = LH or LB, depending on the risk’s objective.
As shown in Figure 1, the second input to the risk’s mechanism are failure modes that impact the probabilistic performance of LP by ∆LP, making the mechanism more or less likely to produce the desired outcome. Some failure modes can be significant, making the outcome event essentially certain if the cause occurs.
ReRA’s strategy of describing two different types of inputs, causes and failure modes, makes it a powerful modeling tool. Which input events are modeled as causes and which are failure modes is up to the modeler’s discretion. The modeler should make the selection based on the probability of the input’s occurrence using the test that the cause must happen for the outcome to occur, while the failure modes only impact the probabilistic performance of the mechanism.
Describing A Risk’s Uncertainty Using Probabilities
Both internal discussions within the analysis team and external communication of the risk analysis to decision makers and regulatory agencies require efficiently and effectively quantitatively describing uncertainty. A serious limitation or weakness of HACCP/PFD methods is their lack of a simple and effective approach for quantitively describing the analysis team’s estimates of uncertainty in definitive and concise terms as a probability.
Probabilities are an invaluable tool for modeling risks because they provide a clear universal method of quantifying uncertainty. However, current risk analysis approaches frequently use complex probability distributions for describing events. Using complex distributions only adds needless complexity that is not justifiable given the level of uncertainty for most risks, especially risks that have human activities as part of the risk’s mechanism. As shown in Figure 1, risk events either occur or they don’t occur. The use of a single-trial Bernoulli distribution provides sufficient information to summarize, record, and communicate the occurrence of a risk’s outcome event.
The difficulty of estimating a risk’s uncertainty depends entirely on the complexity of a risk’s mechanisms. Estimating or calculating the probabilities for well-defined gambling game mechanisms are relatively simple. However, estimating the probabilistic performance LP of complex manufacturing processes and enterprise business practices, especially those containing human activities, can be very challenging. Modeling risks requires a best effort at assembling and using all the knowledge, experience, information, and data to estimate the probability of a mechanism’s performance LP.
Managing harm risks requires describing and managing low probabilities, usually below 10%, while benefit risks require high probabilities, typically above 90%. ReRA provides a likelihood rating method for efficiently and concisely managing both high and low probabilities using a likelihood rating device described in other ReRA articles.11,12 In addition, the likelihood rating system can be used to provide a simple “expected value” adjusted risk likelihood (ARL) rating for prioritizing risk outcomes for further analysis or risk management.13
Structuring A Risk’s Flow Of Events
HACCP and other PFD methods structure processes into risks using a process flow diagram to describe how events flow through a sequence or network of processes, systems, and mechanisms to one or more final outcomes. The purpose of utilizing ReRA’s modeling strategy is to enhance the PFD models so they more quantitatively describe the risk mechanism’s performance on the probability of reaching successful risk outcomes.
Figure 2 shows a simplified PFD for a five-step process for preparing a buffer from raw materials stored in a warehouse.
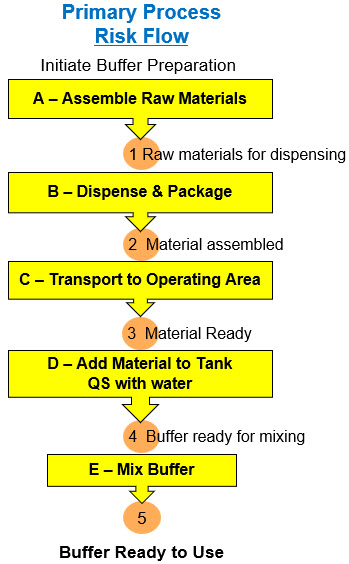
Figure 2: The five processes (A through E) required to make preparing a buffer. The processes, or risk mechanisms, are composed of equipment, procedures, and human activities. The five events (1 through 5) represent the state of the buffer materials during the process sequence for preparing the buffer, with the final event (5) representing the final product or the objective or risk outcome.
The PFD describes the sequence of processes as a foundation for building a system risk structure (SRS) describing how various threats and failure modes to process mechanisms impact critical product attributes, including possible logistical mistakes and other threats, including contamination during the product’s intermediate states for producing the final buffer.
The process flow diagram shown in Figure 2 can be converted from a PFD into an SRS by using the analysis template shown in Figure 3. The template shows how the uncertainty of various causal threats and failure modes might impact the mechanism’s probability of producing or controlling the process element’s outcome.
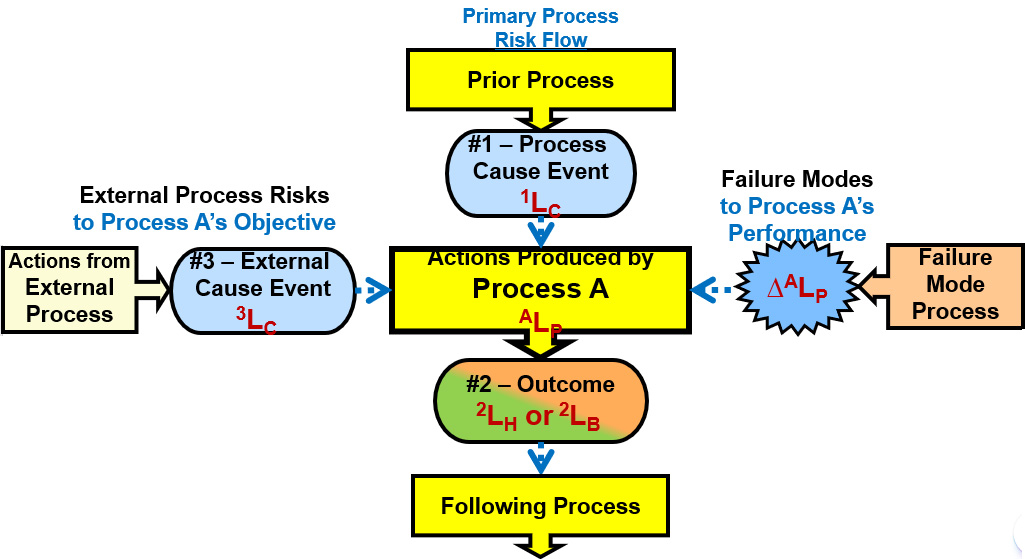
Figure 3: SRS element template showing two risks to process A’s outcome objective event #2. The first threat comes from a prior process (event #1) as the cause event for risk event #1 – process A – event #2 (1-A-2). The second risk is an external risk 3-A-2 from an external threat #3 produced by an external process. Process A is also impacted by one or more failure modes shown on the right that might impact the ALP of both risks.
The process A mechanism has two different risks. The risk associated with the main process risk flow comes from event #1 to process A resulting in event #2 summarized as 1-A-2. The diagram shows an additional risk from an external process that produces an external causal input event #3 that might pass through process A to impact event #2 (3-A-2) as a separate outcome to the risk’s objective. Each risk should be analyzed separately. Despite the possibility of the two risks interacting, they would be modeled and initially analyzed individually.
Both risks impact the success or failure of process A achieving its objective. The ALP for the 1‑A‑2 risk might be different than for the 3-A-2 risk. Process A can be modeled to have several external risks that impact process A’s objectives. Process A could similarly have several different outcome objectives, perhaps both a benefit and harm outcome, depending on the nature of A’s objectives. All the cause-mechanism-effect relationships are initially modeled separately as independent risks using a “divide and conquer” strategy. If the risks are highly interactive, then additional risk relationship models can be developed for analyzing the interactions.
For both risks, process A could have a number of failure modes that might impact the respective ALP values. Each failure mode would have a ∆ALP impact on the respective ALP value. After all the failure modes are evaluated, a final residual value of ALP for each risk can be estimated.
The next step is to take the process flow summary shown in Figure 2 and create an SRS from the process flow diagram using the template shown in Figure 3 to incorporate the ReRA modeling strategy as shown in Figure 1.
Building An SRS From A PFD
Two approaches can be used to take a PFD and turn it into an SRS. The first is to identify the sequence of processes or steps necessary to reach the final objective or prevent the harm to the subject. The sequence of process mechanisms can be subdivided or combined to provide an analyzable continuous sequence from the initiation event to the final outcome impacting the subject of the analysis. The mechanisms should be separated by events that describe intermediate points or states of the objective or deliverable. If those events or states have well-defined criteria for success or failure, then the event can be used as a CCP.
The second approach is to identify the sequence of events or states required, then identify the mechanisms or processes required to connect the events or product states into a continuous sequence. The sequence can start with a consequence of concern and work backward to identify one or more source or cause events. The analysis can also start with a threat or hazard (a constant threat) and identify the connecting processes through events to one or more concerning outcome events.
The process flow diagram for preparing a buffer is shown in Figure 2. The processes have been enhanced using the SRS element shown in Figure 3 for adding the ReRA principles required to analyze the impact of the risk mechanisms on the probability of the process’s outcomes. The resulting SRS for preparing the buffer is shown in Figure 4.
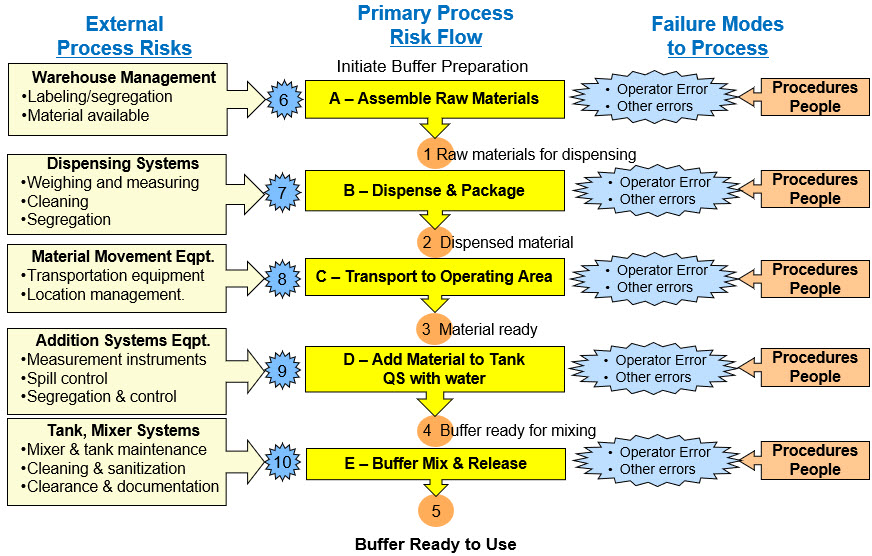
Figure 4: Example of SRS constructed from the PFD shown in Figure 2. The primary risk is 0-ABCDE-5 for successfully making the released buffer. Secondary risks come from the equipment and other mechanisms. A few failure modes for the primary risk mechanisms are shown. Failure modes for the secondary external risks are not shown.
The measurable critical intermediate attribute events or states can be identified as CCPs. As an example, a material inventory can be performed, recorded, and approved using a batch record list (event #3) to assure all the materials are ready and available. In some cases, the SRS can be divided into separate sequences divided by the CCPs to make the analysis more manageable for both analysis and communication purposes.
Once the SRS is completed, the next step is to define the type of risk as either a harm or benefit risk. The type of risk is determined by whether you want to prevent a final harm event or achieve a beneficial objective.
A risk analysis should continue by asking very simple questions to identify simple risk cause-mechanism-effect relationships for both internal and external threats and process failure modes. The simple questions establish the foundation for expanding the analysis to an appropriate level of complexity. After identifying the simple risks that include the consequences of interest, the processes and mechanism should be expanded into sufficient detail for analysis.
Frequently, a complex landscape of interacting risks is identified as having long sequences and networks of simple risks. The risk landscape can be analyzed by identifying and separating the individual risk mechanism elements for identifying their failure modes. The final objective of the risk analysis is to maximize the performance of both the harm and benefit risk mechanisms to minimize the probability of harmful events while maximizing the probability of beneficial outcomes.
In some cases, the analysis of the simple risks might end with either the severity or likelihood of occurrence not warranting more effort. In some cases, CCPs can be monitored using statistical process control (SPC) methods to detect a weakening of the input mechanism’s performance.
Discussion/Future Work
At the time of writing this article, ReRA remains early in its development, with much work required to clarify, evolve, and expand the application of its principles for modeling, analyzing, and managing risks. Other useful examples of using the ReRA analysis strategy can be applied to controlling contamination, minimizing the impact of human errors, and understanding risks associated with medical devices.14,15,16,17
In theory, if all the LP’s of the risk mechanisms can be accurately estimated along with the probability of the initial triggering event L0, then the final LH or LB for every objective or consequence can be accurately estimated. However, the inclusion of failure modes to all the risk’s mechanisms described by the various ∆LP’s that also have their own probability of occurrence will add considerable uncertainty to estimating the LP’s. Failure modes are themselves risks with the output consequence having a severity of ∆LP and likelihood of occurrence that can be estimated and included in the analysis. An article on dealing with the impact of human errors as failure modes provides a start on an approach for modeling failure modes as secondary threats.16
The risk modeling strategies provided by ReRA will provide a rich foundation for building more detailed and effective risk analysis for many complex risks. Eventually, the single-trial Bernoulli probabilities for LP’s can be replaced with more sophisticated probability distributions used in reliability engineering references.18
Reference
- Pierson, M. and D. Corlett, Jr. (ed.); HACCP – Principles and Applications, Van Norstrand Reinhold, 1992.
- Mortimore, S. & C. Wallace, HACCP – A Practical Approach, 3rd Edition, Springer, 2013.
- Pierson, M. & D. Corlett, Jr., ed., HACCP – Principles and Applications, AVI Books, Van Nostrand Reinhold, 1992,
- FDA/National Advisory Committee on Microbiological Criteria for Foods (NACMCF), FDA Website, adopted August 14, 1997, https://www.fda.gov/food/hazard-analysis-critical-control-point-haccp/haccp-principles-application-guidelines#execsum
- Crawley, F, B. Taylor, HAZOP: Guide to Best Practice Guidelines to Best Practice for the Process and Chemical Industries, 3rd ed ., Elsevier Publishing, 2015.
- Ericson, C., Hazard Analysis Techniques for System Safety, 2nd ed., Wiley & Sons, 2016.
- Ericson, C., Fault Tree Analysis Primer, CreateSpace Independent Publishing Platform, 2011.
- ISO 31000:2018 – Risk Management Guidelines – Principles and Guidelines, International Organization of Standardization, 2018.
- ICH Q9 (R1) – Quality Risk Management, FDA, May 2023.
- Witcher, M. F., Why Pharmaceutical and Medical Device Risks Must Be Analyzed By Their Risk Mechanisms, September 16, 2025. Pharmaceutical Online, https://www.pharmaceuticalonline.com/doc/why-pharmaceutical-and-medical-device-risks-must-be-analyzed-by-their-risk-mechanisms-0001
- Witcher, M.F., Using Relational Risk Analysis to Control Procedure Failures, February 15, 2024. https://www.bioprocessonline.com/doc/using-relational-risk-analysis-to-control-procedure-failures-in-the-bio-pharma-medical-device-industry-0001
- Witcher, M.F., Managing Supply Chain Risks Using Relational Risk Analysis, April 5, 2024. https://www.meddeviceonline.com/doc/managing-supply-chain-risks-using-relational-risk-analysis-0001
- Witcher, M., Rating risk Events: Why We Should Replace the Risk Priority Number (RPN) With the Adjusted Risk Likelihood (ARL), April 7, 2021. https://www.bioprocessonline.com/doc/rating-risk-events-why-we-should-replace-the-risk-priority-number-rpn-with-the-adjusted-risk-likelihood-arl-0001
- Witcher, M.F., Managing Contamination Risks in the Pharmaceutical and Medical Device Industries Using Relational Risk Analysis, BioProcess Online, February 2, 2025. https://www.bioprocessonline.com/doc/managing-contamination-risks-in-the-pharmaceutical-and-medical-device-industries-using-relational-risk-analysis-0001
- Witcher, M., Minimizing The Impact Of Human Errors Using Relational Risk Analysis, August 4, 2025, https://www.meddeviceonline.com/doc/minimizing-the-impact-of-human-errors-using-relational-risk-analysis-0001
- Witcher, M.F., A New Approach for Minimizing Human Errors in Biopharmaceuticals and Medical Devices, Bioprocess Online, February 3, 2025. https://www.bioprocessonline.com/doc/a-new-approach-for-minimizing-human-errors-in-biopharmaceuticals-and-medical-devices-0001
- Witcher, M.F., A New Approach To ISO 14971 For Better Medical Device Risk Analysis, Med Device Online, October 23, 2024. https://www.meddeviceonline.com/doc/a-new-approach-to-iso-for-better-medical-device-risk-analysis-0001
- Modarres, M. and K. Groth, Reliability and Risk Analysis, 2nd ed. CRC Press, 2023.
About The Author:
 Mark F. Witcher, Ph.D., has over 35 years of experience in biopharmaceuticals. He currently consults with a few select companies. Previously, he worked for several engineering companies on feasibility and conceptual design studies for advanced biopharmaceutical manufacturing facilities. Witcher was an independent consultant in the biopharmaceutical industry for 15 years on operational issues related to: product and process development, strategic business development, clinical and commercial manufacturing, tech transfer, and facility design. He also taught courses on process validation for ISPE. He was previously the SVP of manufacturing operations for Covance Biotechnology Services, where he was responsible for the design, construction, start-up, and operation of their $50-million contract manufacturing facility. Prior to joining Covance, Witcher was VP of manufacturing at Amgen. You can reach him at witchermf@aol.com or on LinkedIn (linkedin.com/in/mark-witcher).