
Spectrometer-Based Instrument Monitors UV Curing
To evaluate lamp performance in UV curing tunnels, engineers developed spectrometer-based monitoring unit that provides broadband, high-resolution data on illumination output as a function of position and time.
By Peyman Dehkordi, James Riner, and Douglas Ingram, Applied Computing Technology Inc.
Contents
Requirements and Challenges
System Design
Flexible Configuration
In ultraviolet (UV) curing, exposure to ultraviolet light hardens a photosensitive liquid film or coating. The technology is used in applications as diverse as adhesives, graphic arts, metal coatings, building materials, electronics, footwear, leather, textiles, and medical packaging. As UV curing technology has grown, so has the need for improved maintenance and more complex system-level monitoring. Since cure kinetics are sensitive to the intensity and wavelength of the radiation, it is critical that the exposure remain constant throughout the production cycle. This requires consistency of spectral intensity along axis of each cure lamp as well as among all the cure lamps.
A UV monitoring radiometer is typically a single channel instrument that records total energy, or provides minimum/maximum snapshots of the UV energy within a fixed UV band. The pharmaceutical manufacturing industry identified the need for improved maintenance and more complex system-level monitoring of their UV curing process that can be used for other industrial applications. This resulted in the development of a new spectrometer-based monitoring instrument to more thoroughly evaluate curing tunnel energy level at a spectral range of interest (see Figure 1).
Requirements and Challenges
The pharmaceutical manufacturing company's problem boiled down to the fact that when their product line was not curing properly, there were very few ways for their engineering staff to diagnose the source of the problem. In addition, the company did not have an instrument they could use to characterize their initial UV curing process—known as the ‘recipe'—and could use to periodically check UV curing system operation and optimize the curing process on a routine basis.
The application required a unit small enough to be able to travel through the curing tunnel on the standard conveyor system, and sophisticated enough to monitor the spectral intensity output at each component position throughout the pre-cure and/or cure stations of a manufacturing line. In addition, the system needed to allow users to download and analyze the acquired data to properly evaluate the spectral output at each exposure position within the tunnel. Essentially, the system should provide an electronic signature for a given curing system, permitting periodic monitoring, calibration, and optimization of the curing system.
Bulb maintenance is a major engineering issue in curing systems for the following reasons:
- Bulb usage logs do not reflect high-power versus low-power times, but only the amount of time that current has passed through the lamp. They also do not reflect starts, another critical component of bulb life. In other words, time logs do not providing the information desired relating to bulb replacement frequency.
- A bulb's spectral output can change over time, which can yield products that are either uncured or partially uncured. Once a curing recipe, or spectral output effect, is established for a given process, the system must maintain that performance. Thus, monitoring bulb emission is key to efficiency.
- The level of energy produced by the bulb may change over time, affecting a production run of the product being cured. In many ink, coating, or adhesive curing applications, total energy determines the degree of polymerization. If each lamp operates at different levels, then it is possible to have portions of the production run cured at different energy levels.
- Particles or foreign material on the bulb causes additional heat generation, which darkens the thin film on the surface and reduces the amount of energy, which can be transmitted by the bulb.
- When curing problems are found, reflectors should also be evaluated. Reflectors focus the light energy from the ultraviolet lamps to the product being exposed. They lose their reflecting properties over time due to a variety of factors.
All of these issues argue for consistent, accurate monitoring of bulb performance.
System Design
The 120 mm x 60 mm x 20 mm spectral monitoring instrument developed consists of two primary parts: the data collection unit (DCU) and the data display unit (DDU; see Figure 2). The DCU is a self-contained battery-operated spectral energy collection device that contains a miniaturized spectrometer fitted with a fiber optic cable to transmit the signal, plus associated data acquisition electronics. The device collects the spectral distribution and intensity of incident light, stores the spectral irradiance data with a time stamp, and communicates with the DDU. The DDU is a PC-based docking station that interfaces with the DCU and displays the collected spectra in different graphical views. It also allows the user to generate an electronic signature for analysis, evaluation, and comparison with a base signature.
The pallet-based DCU is placed on a conveyor system to pass through the curing tunnel. In the tunnel, the instrument acquires a synchronized spectrum in the customer process, converts the raw spectrogram into a calibrated spectrogram for each wavelength, displays the spectrum on the computer screen, and uses ACT proprietary desktop software to evaluate the spectral data acquired from one test to another.
This single-channel instrument may be used for position-sensitive or time-sensitive measurements. An important capability of the instrument is its ability to map the energy levels acquired by the data collection unit over time. A post-acquisition display of the data is available to allow for easy comparison of the spectral output from each position measured over time. This feature enables the user to analyze and optimize their operations based on the data acquired.
The unit operates over a spectral range from 380 to 750 nm, with spectral resolution of 7 nm. It can acquire up to 1024 full-range spectra.
Flexible Configuration
The associated package allows control of many parameters. The user can select duration of sample acquisition by choosing an integration time from 22 ms to approximately 18 s. The sample time—frequency at which data is acquired in the curing tunnel—ranges from 66 ms plus integration time, to roughly 18 s plus integration time. To enhance sensitivity, the user can also choose a high gain option that permits shorter exposure or integration time, yielding a better representative picture of UV bulb operation in the curing tunnel.
The user can configure the monitoring unit as a position-sensitive or time-sensitive instrument. If a position-sensitive measurement is desired, then acquisition will be based on an irradiance level in percent. If a time-sensitive measurement is desired, then acquisition will be based on a time measurement in seconds, or the time it takes to go through the curing tunnel.
The DDU can display absolute energy as a function of wavelength or time, accumulated energy as a function of time, or relative spectral energy (see Figure 3). It can determine maximum, minimum, average, standard deviation, and sum of the spectral region of interest. It can also perform basic arithmetic operations.
The energy versus wavelength view shows the Y-axis as spectral irradiance and the X-axis as wavelength (see Figure 4). This is a common spectrograph view used often to examine the spectrograph curve for peaks and valleys. In this view, multiple spectra taken over time will be displayed overlapped. Using the plus key, the user may select different spectra of focus, of which its statistics will be displayed to the right.
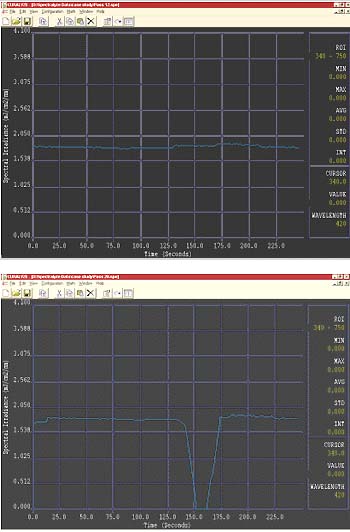
In an example of quality control, a Spectralyze instrument was passed through a cure tunnel several times over the course of one week. During the time in question, a cure lamp within the tunnel began degrading and emitting less energy, as detected at 420 nm, until the lamp was exhausted and emitting no light at all (see Figure 5). While the human eye could not detect the subtle changes in irradiance, the Spectralyze instrument can allow the operator to detect the problem early and replace the curing lamp before quality issues arise.
With a need for a more technology-based approach to UV curing system diagnostics, the Spectralyze monitoring instrument provides process and R&D engineering staff with the capability to thoroughly evaluate their curing system, characterize their curing process, diagnose problems that occur in the process, and optimize the curing process on a regular basis. As experience with this spectrometer-based instrument grows, additional applications will be found with a need to improve system operation, reduce operating costs and increase equipment longevity. In the development of this instrument, technology and information have come together to meet a manufacturing need to create more complex system-level monitoring capabilities for plant engineering and R&D personnel.
References
- John Moubray, Relibility-Centered Maintenance, ISBN number 0831130784, TWI Press Inc., Terre Haute, Indiana, 1997.
- Louis Panico, Current Developments in Pulsed Light or "Flash" Curing Technology, Xenon Corp., white paper.
- Stephen Siegel, Ultraviolet Curing System and Process, UV Process Supply Inc. white paper.
- Stephen Siegel, The Maintenance of UV Curing Equipment, Radiation Curing, Volume VII, Number 1, February, 1980.
About the Authors
Peyman Dehkordi, James Riner, and Douglas Ingram are with Applied Computing Technology Inc., 1010D Commerce Park Drive, Oak Ridge, TN 37830. Tel: 865-220-0777. Fax: 865-220-2030. For more information, contact Jim Riner, director of sales and marketing at 865-220-0777 or jriner@applied-computing.com.
Source: Photonics Online, sister website to Medical Design Online.