
What Is All The Hype About Resolution And Mega Pixels Anyway?
Resolution, in the context of an image sensor, describes the total number of pixels utilized to create an image. Characterizing the resolution of an image sensor simply refers to the pixel count and is generally expressed as the horizontal number of pixels multiplied by the vertical number of pixels, for example:
𝑛𝑢𝑚𝑏ℯ𝑟 𝑜𝑓 𝑝𝑖𝑥ℯ𝑙h𝑜𝑟𝑖𝑧𝑜𝑛𝑡𝑎𝑙 × 𝑛𝑢𝑚𝑏ℯ𝑟 𝑜𝑓 𝑝𝑖𝑥ℯ𝑙𝑣ℯ𝑟𝑡𝑖𝑐𝑎𝑙 = 𝑡𝑜𝑡𝑎𝑙 𝑛𝑢𝑚𝑏ℯ𝑟 𝑜𝑓 𝑝𝑖𝑥ℯ𝑙
For instance, the sCMOS image sensor CIS2521 has the following resolution:
(2560h𝑜𝑟𝑖𝑧𝑜𝑛𝑡𝑎𝑙 × 2160𝑣ℯ𝑟𝑡𝑖𝑐𝑎𝑙) 𝑝𝑖𝑥ℯ𝑙 = 5.5 𝑀𝑝𝑖𝑥ℯ𝑙
The above calculation is typical for technical data sheets and marketing materials for scientific cameras, and would seem that more pixels would always be beneficial, but the title question remains, why does the pixel count matter?
Benefit and Relevance for a Camera User
Assuming an image sensor, or a camera system with an image sensor, is generally used to detect images and objects, the critical question is what the influence of the resolution is on the image quality. First, if the resolution is higher, more spatial information is obtained, and as a consequence, larger data fi les are generated. Second, the amount of information, which can be obtained by a camera, is inseparably connected to the applied imaging optics, and the optics are characterized by their own optical resolution or ability to resolve details and must also be considered.
Figure 1 illustrates the influence of resolution between its limits of “Blurred” and “Sharp”, and the influence of contrast between its limits of “soft” and “brilliant” on the image quality, where, the higher the resolution of an optical system (consisting of a camera and imaging optics), the more the images become “sharp”, while a “brilliant” contrast helps to distinguish the white and black lines even if they are not sharp.
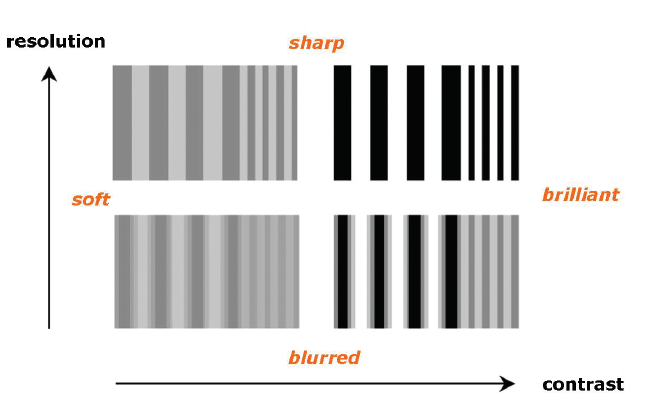
Figure 1: The graph illustrates how a black/white line test image is influenced between the limits “blurred” – “sharp” in resolution (y-axis) and between the limits “soft” – “brilliant” in contrast (x-axis).
Image Sensors and Cameras
Starting with the image sensor in a camera system, the modulation transfer function (MTF) describes the ability of the camera system to resolve fi ne structures. It is a variant of the optical transfer function1 (OTF) which mathematically describes how the system handles the optical information, or contrast of the scene or the sample, and transfers it onto the image sensor and then into a digital format for processing via computer. The resolution ability depends on both the number and also the size of the pixel.
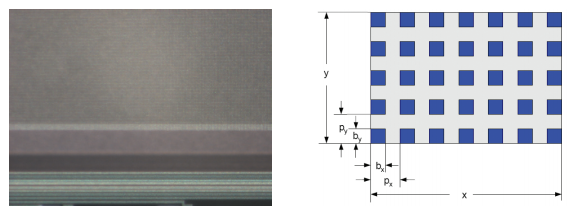
Figure 2: a) A macro image of a CCD image sensor showing Sagittal lines the pixels at the edge of the imaging area, b) illustration of an image sensor with characteristic geometrical parameters: x, y - horizontal, vertical dimensions, px, py - horizontal, vertical pixel pitch, bx, by - horizontal, vertical pixel dimensions
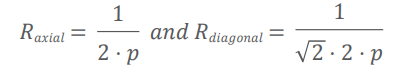
The maximum spatial resolution is described as the ability to separate patterns of black and white lines and it is given in line pairs per millimeter ([lp/mm]). The theoretical limit is given in the literature and defines the maximum resolution achieved if one black line is imaged on one pixel while one white line is imaged to the neighbor pixel. Assuming square pixels with bx = by = b and px = py = p (see fi g. 2 pixel schematic) then the maximum possible axial Raxial and diagonal Rdiagonal resolution ability is given by the pixel dimensions:
The following table depicts the maximum resolution ability values for image sensors with various pixel sizes.
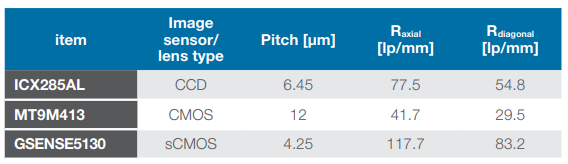
Table 1: Maximum theoretical MTF data of select image sensors
The contrast which is transferred through the optical system consisting of camera and imaging optics is defined as contrast or modulation M, with the intensity I [count] or [DN]2 in an image:

The modulation depends on the spatial frequencies, which means that M is a function of the resolution R: M = M(R). The quality of the imaging process is described by the modulation transfer function, MTF. Thus, both parameters, the resolution and the contrast, defi ne the quality of an image, as is illustrated in fi gure 1. Increasing resolution improves the sharpness of an image while increasing contrast adds to the “brilliance”.
Keep in mind the above equation represents only the maximum possible MTF and requires the measuring pattern to be optimum positioned, if the line pair pattern is shifted by half a pixel, nothing could be seen, as shown in fi gure 4. This is illustrated by three different use cases. Let us assume the structure to be resolved is given by these black and white line pairs. Figure 3 shows what happens if the pixel of an image sensor has the same pitch like the width of one line pair.
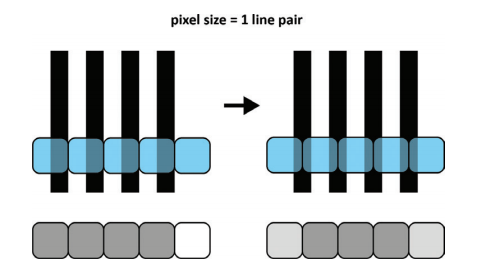
Figure 3: Illustration of a line pair structured optimum imaged to one row of pixels which have a pitch, similar to the width of the line pair. Left: the structure is imaged in a way that each pixel “sees” a line pair. The pixel row below shows the resulting measured light signal of the corresponding pixel. Right: the structure is shifted compared to the pixel row and the pixel row below shows the resulting measured light signal of the corresponding pixel above.
In this case the structure could never be resolved, even if it is moved, the resulting light information (see fig. 3 pixel rows) are not able to give enough information about the structure. If now the theoretical maximum MTF is assumed, we come to the illustration in figure 4.
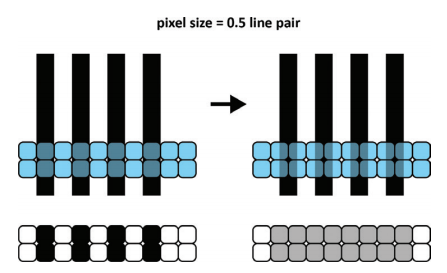
Figure 4: Illustration of a line pair structured optimum imaged to one row of pixel which have a pitch, similar to half the width of the line pair. Left: the structure is imaged in a way that each pixel “sees” either a black or a white line. The pixel row below shows the resulting measured light signal of the corresponding pixel. Right: the structure is shifted compared to the pixel row, now the pixel always registers half white and half black, with the pixel row below shows the resulting measured light signal of the corresponding pixel above.
Only in the case that the structure is imaged in a way that each pixel “sees” either black or white, the maximum MTF can be reached. In case the structure is shifted by half a pixel all the information is gone, and nothing can be resolved. Therefore, the maximum theoretical MTF value is a nice start, in case the user has to estimate some starting values for the imaging optics used with a camera system. A more practical case and condition is shown in figure 5.
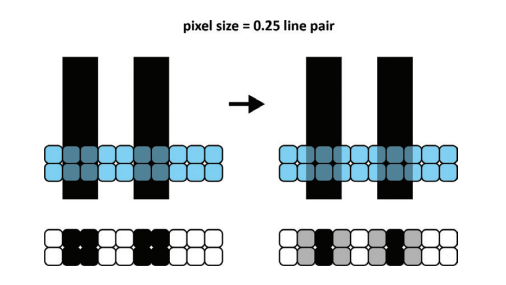
Figure 5: Illustration of a line pair structured optimum imaged to one row of pixel which have a pitch, similar to the quarter of the width of the line pair. Left: the structure is fully resolved by the pixel. The pixel row below shows the resulting measured light signal of the corresponding pixel. Right: the structure is shifted compared to the pixel row, still the structure can be resolved with a little bit less sharpness compared to the left image. Again the pixel row below shows the resulting measured light signal of the corresponding pixel above.
Now the pixel pitch corresponds to the quarter of the line pair width (see fi g. 5). In this case the structure can always be resolved with more or less sharpness, even if the structure is not optimally positioned on the pixel row.
Therefore for each imaging application for the structures which have to be resolved it is important to match the imaging optics to the resolution and the pixel size to the image sensor in the camera system, to finally get best possible results.
Imaging Optics – Camera Lens
Lens manufacturers like Zeiss, Nikon, and Canon offer either simulated MTF curves of their lenses or measured data and also provide material how to understand and use these lens MTF charts or curves3,4,5. For example, Nikon distinguishes two groups of data plotted on an MTF chart, they call them Sagittal and Meridonial lines. Zeiss calls these lines sagittal and tangential, and it is about how a parallel line pair pattern is oriented compared to the image sensor.
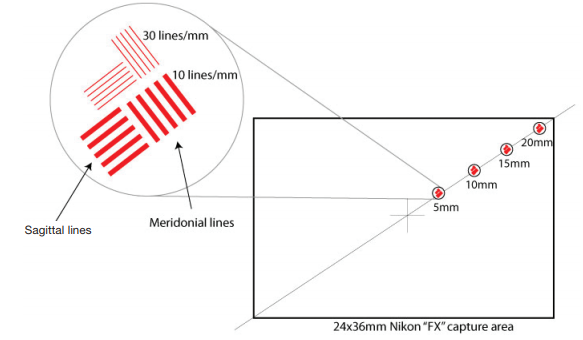
Figure 6: Illustration of the orientation of the test patterns for MTF measurements of camera lenses (taken from: https://www.nikonusa.com/en/learn-and-explore/a/products-and-innovation/what-is-a-lens-mtf-chart-how-do-iread-it.html).
In the definition of Nikon the “Sagittal lines” (the solid lines) represent the contrast measurements of pairs of lines that run parallel to a central diagonal line that passes through the middle of the lens from the bottom left hand corner to the top right hand corner. The “Meridonial Lines” (see fi g. 7, the dotted lines) represent line pairs also positioned along an imaginary line from the center of a lens to the edge but these line pairs are perpendicular to the diagonal line.
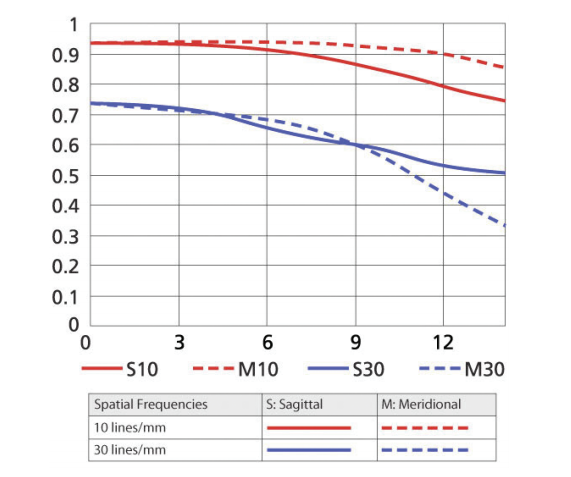
Figure 7: Nikon lens MTF chart example for different linepair resolutions: 10 lines/mm and 30 lines/mm (taken from: https://www.nikonusa.com/en/learn-and-explore/a/products-and-innovation/what-is-a-lens-mtf-chart-how-do-iread-it.html).
Nikon shows two groups of test lines for each Sagittal and Meridonial value: one set of line pairs at 10 lines per millimeter (resolution 100 µm) and a second set at 30 lines per millimeter (resolution 33 µm). The lower line pairs (10 lines/mm) will generally give better results than the more challenging fi ne resolution 30 lines/mm. In figure 7 in the graph the y-axis gives the contrast or modulation M value in relation to the distance from the center of the image circle (which would be the center of an image sensor as well).
Imaging Optics – Microscope Objective
Defining resolution becomes more complex in microscopy, since there are typically not MTF charts available and multiple lenses or objectives are involved in the image reaching the camera. But there are characteristic parameters and physical relationships that help to determine the best possible resolution.
In microscopy, a function termed the “Rayleigh criterion”6 (see fig. 8) describes the minimum distance between two objects and the ability to separate them as a function of the numerical aperture (NA) of the objective and the spectral wavelength of the light that should be detected. In a simplified way it is given by:
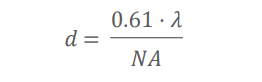
(with distance d = width of line pair, λ wavelength and numerical aperture NA of the objective). The major parameters of each microscope objective are the magnifi cation Magobj and the numerical aperture NA.
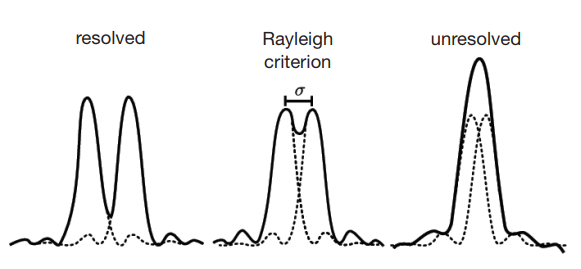
Figure 8: Schematic to show the Rayleigh criterion, if two point signals (dotted curves) which can be resolved (left graph, solid line is the impression of the optical system) approach each other, they reach a minimum distance, in which they still can be resolved (middle graph, Rayleigh criterion, solid line is the impression of the optical system). If the distance is further decreased, both signals cannot be resolved and they are perceived as one signal (right graph, unresolved, solid line is the impression of the optical system)7.
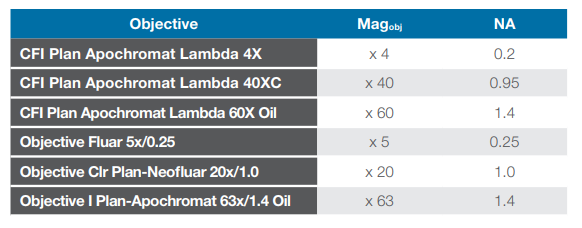
Table 2: Parameters of microscope objectives
The total magnification of the object on the microscope stage is defined as magnification of the microscope objective multiplied by the magnification of the so called TV- or camera-adapter, which consists of a lens with c-mount and mount to the microscope which serves as “ocular” for the camera. Therefore the total magnification Mag to be considered is:
𝑀𝑎𝑔 = 𝑀𝑎𝑔𝑜𝑏𝑗 ⋅ 𝑀𝑎𝑔𝐶𝑎𝑚Ad
From the chapter before it was concluded that the optimum pixel size or pitch should be equal to a quarter of the line pair width which corresponds to the minimum resolvable distance.
𝑝𝑖𝑥ℯ𝑙 𝑝𝑖𝑡𝑐h𝑜𝑝𝑡 = 0.25 ⋅ width of line pair = 0.25 ⋅ d
If now the Rayleigh criterion is inserted for d and the total magnification of the optical path in the microscope is included, the pixel pitchopt can be expressed as follows:
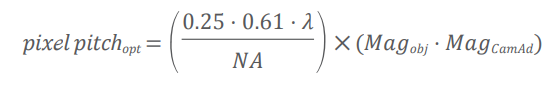
To illustrate the consequences, let’s take an example: an objective with Magobj = 60 and NA = 1.4, the camera adapter has a MagCamAd = 1.0 and blue-green fluorescence with λ = 514 nm should be observed:
![]()
This means a relatively small pixel pitch. Just in case an objective would be used with a smaller NA, for example like NA = 0.93, the resulting optimum pixel pitch would be 5.2 μm. The result is similar sensitive towards the correct chosen magnification of the camera adapter, if it is for example smaller like MagCamAd = 0.5, the optimum pixel pitch would be 1.7 μm. As well if we just apply the theoretical limit of 0.5 times the width of the line pair, it would result in 6.8 μm.
Or it is possible to take an existing pixel pitch, which is popular for emCCD and some new sCMOS image sensors like 11 µm and ask what the optimum magnifi cation Magobj of an objective is, if we assume an NA around 1.

With a pixel pitch = 11 µm, NA = 1.0, MagCamAd = 0.7 and the same wavelength like before λ = 514 nm we would get:
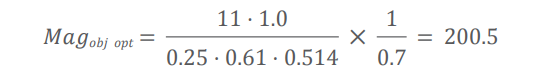
This is well above the largest common magnifications of 150 for microscope objectives. The value could be optimized by a larger magnification of the camera adapter, but this would reduce the imaged area compared to the area as seen through the oculars.
It might be possible that the optimum value is not achieved. Nevertheless, attention has to be taken on a proper selection of objective and camera when a camera should be used at a microscope in a specific application.
END NOTES
1. https://en.wikipedia.org/wiki/Optical_transfer_function
2. DN = digital number, like count
3. https://www.nikonusa.com/en/learn-and-explore/a/products-and-innovation/what-is-a-lens-mtf-chart-how-do-i-read-it.html
4. https://photographylife.com/how-to-read-mtf-charts
5. https://diglloyd.com/articles/ZeissPDF/ZeissWhitePapers/ZeissHowToreadMTFCurves.pdf
6. https://en.wikipedia.org/wiki/Angular_resolution
7. Schematic taken from: https://www.researchgate.net/publication/298070739_Tomographic_reconstruction_of_combined_tilt-_and_focal_series_in_scanning_transmission_electron_microscopy
Click here to download the PDF version.