
Why Use Total Organic Carbon Analysis For Cleaning Validation?
By Andrew Walsh; Thomas Altmann; Joshua Anthes; Ralph Basile; Alfredo Canhoto, Ph.D.; Stéphane Cousin; Hyrum Davis; Parth Desai; Boopathy Dhanapal, Ph.D.; Jayen Diyora; Igor Gorsky; Benjamin Grosjean; Richard Hall Hall; Solenn Janvier, Ph. D.; Ovais Mohammad; Mariann Neverovitch; Miquel Romero-Obon; Jeffrey Rufner; Siegfried Schmitt, Ph.D.; Osamu Shirokizawa; Steven Shull; Stephen Spiegelberg, Ph.D.; and John VanBerschot

Part of the Cleaning Validation For The 21st Century series
The ASTM E3106 Standard1 states that the selection of analytical methods for use in cleaning validation “should be science and risk based,” and that “The goal should be to use a method that is fit for use and can be justified.” A previous article discussed how to use a science- and risk-based approach to select analytical methods using ASTM Standards.2 This article will explore why total organic carbon (TOC) analysis is probably the most “fit for use” analytical method to validate cleaning processes. Its use can be scientifically justified, especially with the move to a science- and risk-based approach.
Why Use TOC?
Virtually all pharmaceuticals and most of their excipients are organic carbon-based compounds; therefore, TOC can be used for detecting active pharmaceutical ingredients (APIs), their degradants, excipients’ residues, detergent residues, or any organic carbon residues that may be present. TOC can detect the presence (or absence) of all of them with just one test. TOC can be viewed as the “Geiger counter” for organic carbon. Therefore, TOC is ideal for cleaning validation, since we are hoping to demonstrate that nothing is there after cleaning. While TOC has been widely used in the biotech industry for many years, TOC may be widely suitable for many applications in the pharmaceutical and medical device industry as well.
As TOC is non-specific, the results obtained potentially represent all of the organic carbon compounds that could be present in the sample. This allows for the possibility that several analyses could be performed using one sample result. TOC results can be calculated as an API, a degradant, a cleaning agent, or any organic compound that might be present in the sample. Figure 1 shows how one TOC result can be evaluated against multiple cleaning limits.
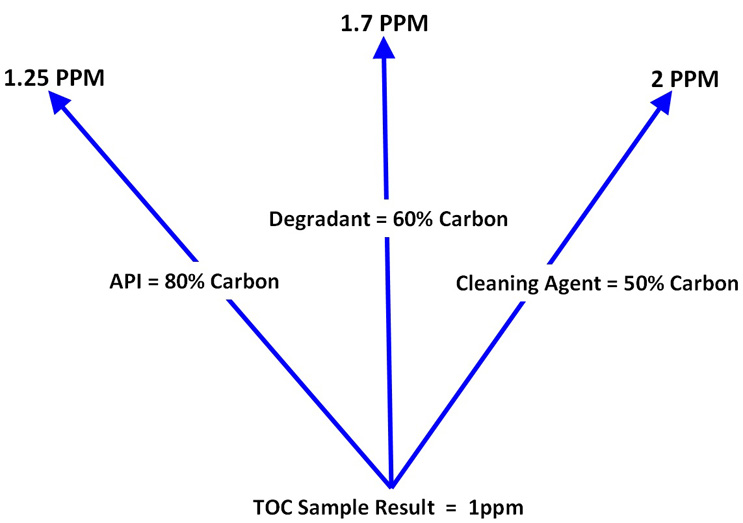
Figure 1: Example of a 1 ppm Sample Result Calculated as Multiple Compounds - In this example a single TOC sample result is calculated as three different compounds based on their organic carbon content. In each example the TOC result (1 ppm) is assumed to be only from that compound. If the result (1 ppm) is below the lowest limit for all of these compounds (1.25 ppm), it can be assumed to be meeting the acceptance limits for all of the organic carbon containing compounds possibly present in the sample. Also, since it is unlikely that all the TOC in the sample is from only one source, this assumption is a "worst case" approach.
If the result does not meet one of its acceptance criteria of any of the compounds, it will then be unclear which compound(s) may be causing the signal and a follow-up analysis to investigate the root cause of the failure may be required to identify the compound(s). This may simply involve subjecting the remaining sample to additional analyses such as HPLC or micro-NIR to identify the compound.
(Based on a graphic created by Nikunj Vasoya, with permission from Nikunj Vasoya.)
While TOC would appear to be ideal for use in cleaning validation, there are a number of questions about its use that need to be addressed.
Is TOC Accepted By Regulators?
A common challenge the authors still hear today is that FDA and other regulators do not accept TOC as an analytical method for cleaning validation. This was never true and FDA even posted a statement on its website over 20 years4 ago clarifying that TOC is acceptable as long as its use has been justified.
Can "Water Insoluble" Compounds Be Analyzed By TOC?
It has been argued that water solubility of the compound has been a necessary condition for the use of TOC. Since many pharmaceuticals are considered "water insoluble" this would suggest that the use of TOC with these compounds for cleaning validation studies is not appropriate. However, even the most “water insoluble” compounds are soluble to some extent. Table 1 shows the definitions for "Very Slightly Soluble" and "Practically Insoluble, or Insoluble" found in the United States Pharmacopeia (USP).
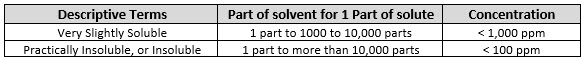
Table 1: Definitions of Solubility from United States Pharmacopeia
ppm = parts per million
The concentrations (in ppm) in Table 1 are substantially above the detection limits of TOC, which theoretically can go down to low ppb (parts per billion; µg/L). These are also well above the typical TOC residue levels found after successful cleaning, which in practice averages about 150 ppb to 200 ppb.3 Theoretically then, residues at these levels should be easily soluble and "water insolubility" may not necessarily be a constraint for TOC.
Table 2 shows the results of a study performed by Yaohai (Nick) Cao and Andrew Walsh at Johnson & Johnson (Ortho-McNeil) in 19965 in which 316L/#4 finish stainless-steel coupons with a 10-cm x 10-cm test area were spiked with sulfa drug solutions at a level of 0.4 mg/cm2. This study was performed on three different sulfa drugs. The coupons were swabbed with three swabs using low TOC water and the swab heads were cut off and diluted in 20 mL of low TOC water. The spike level, swab area, and dilution volume were specifically designed to achieve a target concentration of 2 ppm of TOC in the sample vial. The rationale for this was that approximately 99% of all TOC swab data collected during cleaning validation studies were below the level of 1 ppm. Quantitative recovery at 2 ppm would be strong evidence that the previous data were reliable and representative of the actual residue level on the equipment. After running the samples on a TOC analyzer, the remaining volume of sample was also analyzed using HPLC to confirm that the TOC results were from the sulfa drugs.
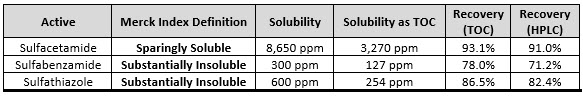
Table 2: Water Solubility and Swab Recoveries of Sulfa Compounds by TOC and HPLC.
Note: The Merck Index Definitions for Sulfabenzamide and Sulfathiazole fall between the USP definitions in Table 1.
The data obtained clearly demonstrated that these "water insoluble" compounds were quantitatively recovered at a level of 2 ppm. Subsequent studies over the past 30 years of many other "water insoluble" compounds have shown the same quantitative recoveries. There is, of course, a minimum water solubility necessary to allow for swab recovery studies, but insufficient solubility has only been found for a very small number of compounds.
So, the solubility definitions of “insoluble,” “sparingly soluble,” “substantially insoluble,” etc., do not necessarily exclude the use of TOC, and virtually all pharmaceutical compounds can be quantitatively recovered using only water as a swabbing solvent at the levels typically encountered after cleaning. Studies have also determined that water acidified with phosphoric acid can dramatically improve recovery in some cases.5
Can TOC Actually Quantify What Is In The Sample?
One of the questions concerning the use of TOC has been that the actual value of the compound(s) detected is uncertain. That is, it is not clear what a TOC result of 1 ppm actually means in terms of residue since the actual organic carbon content is not known. So, its true value cannot be calculated as shown in Figure 1. It has been said that the result could be anything.
This is also true of unidentified peaks (also called extraneous peaks, unknown peaks, or ghost peaks) found during HPLC analysis. Without the coefficient of extinction for these peaks, their true values cannot be calculated (Figure 2).
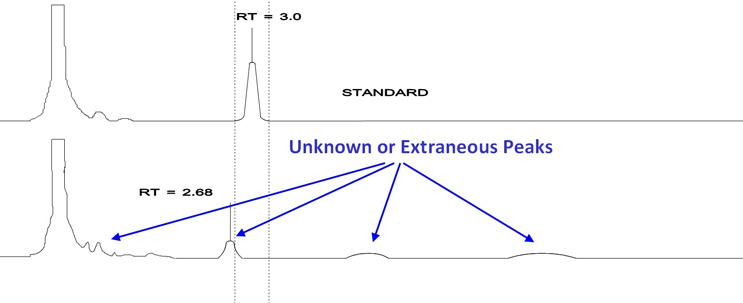
Figure 2: Example Chromatographs showing Unidentified Peaks
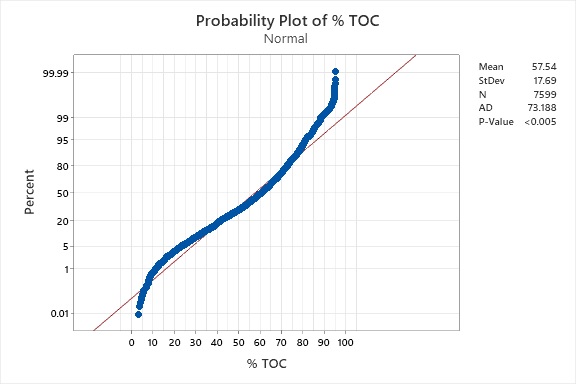
Over a 10-year period, graduate students in the Pharmaceutical Manufacturing and Engineering Program at the Stevens Institute of Technology tabulated 7,599 of the compounds found in the Merck Index (12th Edition), and the percent carbon of the compounds was recorded, if present, or calculated from their empirical formulae. Not all of the entries in the Merck Index contained organic carbon, and these were not included in the list. This was a tedious exercise that required the efforts of a long list of students; in the end, the carbon content of all 7,599 compounds was determined. Figure 3 is a histogram showing the distribution of the percent carbon for all 7,599 compounds.

Figure 3: Histogram of % TOC for 7,599 Compounds from the Merck Index
While these data are somewhat normally distributed, they are clearly skewed to the right. A test of normality (Figure 4) was run that showed a P-value of <0.005, so in this case statistical analyses based on the normal distribution are typically not recommended, and non-normal distributions such as the lognormal should be used instead. However, there is some evidence that the lognormal should not necessarily be chosen based on skewness of data and that the majority of population (95%) in a lognormal distribution will be within two standard deviations regardless of the skewness.6 The amount of data in the tails may actually be insignificant for many analyses. This observation may justify choosing the normal distribution as the model even when the data are found to be skewed.
However, for non-normally distributed data like this, nonparametric techniques can be used instead. Figure 5 shows the results of a 99% tolerance interval analysis for 99% of these data, which had a low tolerance interval of 8.14 % and a high of 93.28%.
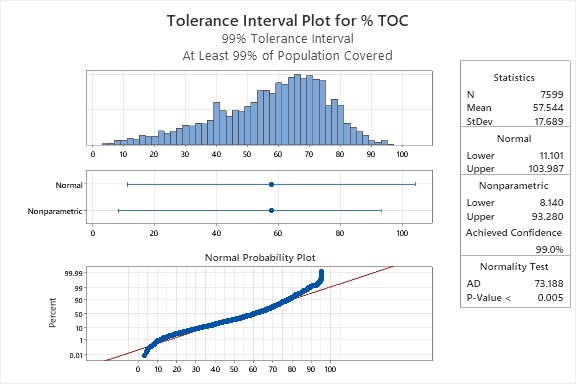
Figure 5: 99% Tolerance Interval for the 7,599 Compounds from the Merck Index (12th Edition)
These tolerance intervals were then converted into their corresponding values and, for the sake of comparison, regular statistical analyses were performed assuming a normal distribution and three other non-normal distributions. This analysis shows that:
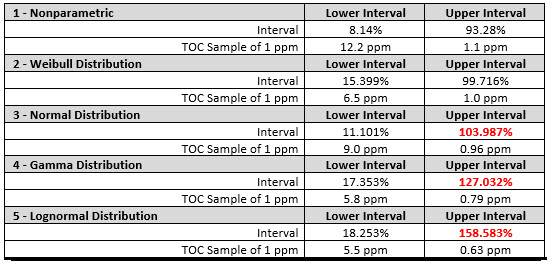
The comparison of the tolerance intervals in Table 3 shows that these other distributions do not give equivalent results, in particular for the upper intervals. Only the Weibull remained below 100% while the normal, gamma, and lognormal all exceeded 100%; this was substantial for the gamma and lognormal, making them unsuitable for this statistical analysis. As discussed above, it might be acceptable to use a lognormal distribution for skewed data where the data in the tails are not of interest, but in this analysis the data at the very end of the tails is precisely what is of interest. It is not logical to assume that the TOC content of a 1 ppm result exceeds 100% and then adjust the result to less than 1 ppm. So, for this type of analysis a nonparametric approach is required.
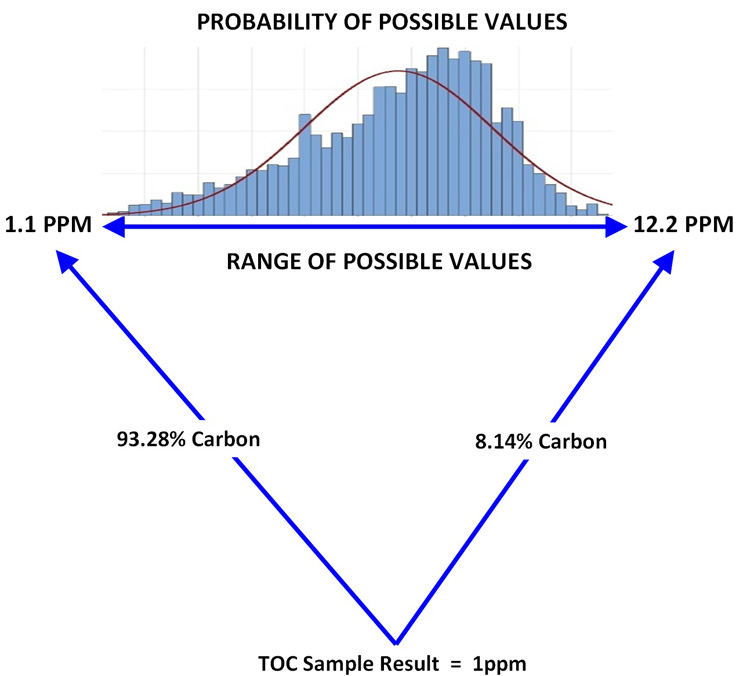
Figure 6: Example of a 1 ppm Sample Result Calculated Using Tolerance Intervals - In this example a single TOC sample result is calculated as a range of possible values based on the nonparametric tolerance interval analysis in Table 3. The probability for each value in this range is reflected in the histogram of the frequency of the data above the range.
When using TOC, unlike with unidentified peaks in HPLC, it is possible to calculate a range of results that covers 99% of the possible TOC values with 99% confidence that the range contains the actual value. So, it is fair to say that a 1 ppm result, or any TOC result, as shown in Figure 6, can be translated by these nonparametric tolerance intervals into results that would more accurately cover all the possible compounds that might have been in the sample given the initial 1 ppm result, or for any TOC result as shown in Figure 6. If a limit can be applied to these data, such as a threshold of toxicological concern (TTC), this would allow TOC to be used as a general tool for demonstrating equipment or medical device cleanliness for any possible residue.
Discussion
One of the most important benefits of using TOC is that method development and validation are greatly simplified. There is only one method using only one instrument. There is no need for multiple methods using different instruments with different configurations, such as is found with HPLC (although there have been recent promising advances with using UHPLC2). The TOC method need only be validated once with additional work directed to recovery studies. As the method is simple to set up, the speed of analysis is faster than that of many other analytical methods. The cost of the TOC instruments can be considerably lower than for instruments such as HPLC and the overall cost of ownership is very low. The primary reagents used in the analysis (e.g., phosphoric acid and ammonium persulphate) are very inexpensive as compared to the numerous organic solvents used in HPLC. These features make TOC very practical and useful in an overall validation scheme and over the long-term.
Process Analytical Technology (PAT) Applications
TOC also has application and provides evidence in the risk control stage of the cleaning validation life cycle for continued monitoring and in statistical process control (SPC) programs. TOC can be easily used for at-line PAT approaches (Figure 7). TOC is a rapid method, and samples can be taken immediately after a cleaning process is complete and analyzed within minutes. Such an at-line approach can result in parametric release of cleaned equipment, improving manufacturing process efficiency.
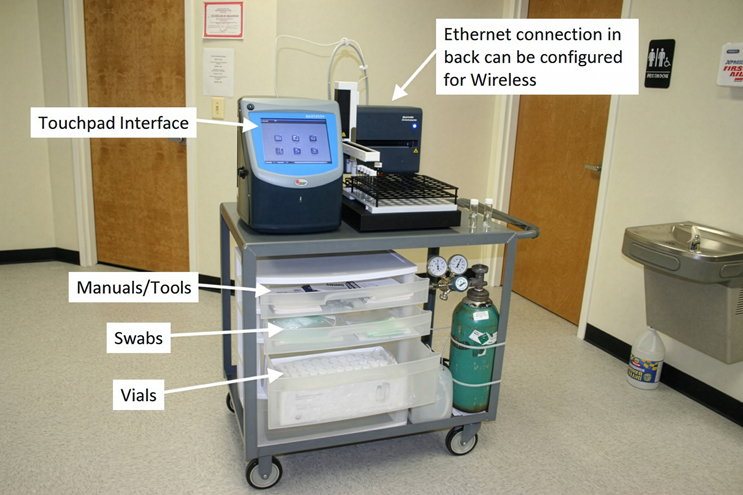
Figure 7: Example of a QbD 1200+ TOC Analyzer Setup Specifically for At-line PAT. QbD1200+ courtesy of Beckman Coulter.
TOC Combined With TN Analysis For Biopharmaceutical Applications
Some TOC systems can also identify the total nitrogen (TN) of the sample. This may be very useful for biotechnology products, since DNA, RNA, proteins, and peptides are carbon and nitrogen-containing compounds and have a fixed ratio of carbon to nitrogen (C:N). If this C:N ratio of the compound is known, the C:N ratio can be used to estimate the levels of that compound in cleaning sample residues. For example, an investigation of viral proteins7 found an average C:N ratio of 3.6:1. If the C:N ratio of the cleaning sample matches that of the known C:N ratio of the compound, then it can be assumed that the entire TOC result of the sample can be assigned to the compound. Other potential cleaning residues, such as many detergents, do not contain any nitrogen. So, if residues of these detergents are also present in the cleaning sample, the C:N ratio will be larger than the known ratio. This approach can provide additional information about the content of the cleaning sample and may allow assigning a more accurate evaluation of the process residue.
Summary
The selection of methods for assessing cleaning should be science-based and risk-based. Key considerations for the risk assessment under ASTM E3106 include the hazard of the process residue (toxicity score) or risk of exposure to the process residue (Cpu score) and the level of detection required (e.g., CDI score). Other considerations may include the applicability of existing methods, quality and compliance risks, as well as risks to the business such as difficulty of implementation and the possible long-term maintenance of the analytical method for ongoing monitoring programs. A simple, inexpensive yet accurate, reliable, precise, and compliant method can be appropriate for many process residues provided appropriate risk assessment and method validation have been performed.
As discussed in the previous article on science- and risk-based analytical method selection,2 methods with low detection limits are most desirable. So, our next article will describe how to determine the detection limits for TOC and how to obtain the lowest detection limits.
Peer Review
The authors wish to thank Joel Bercu, Ph.D., Julio Barbosa, Sarra Boujelben, Gabriela Cruz, Ph.D., Andreas Flueckiger, MD, Christophe Gamblin, Ioanna-Maria Gerostathi, Ioana Gheorghiev, MD, and Ajay Kumar Raghuwanshi for reviewing this article and for providing insightful comments and helpful suggestions.
References
- American Society for Testing and Materials (ASTM) E3106-18 "Standard Guide for Science-Based and Risk-Based Cleaning Process Development and Validation" www.astm.org.
- Walsh, Andrew; Thomas Altmann; Joshua Anthes; Ralph Basile; Alfredo Canhoto, Ph.D.; Stéphane Cousin; Hyrum Davis; Parth Desai; Boopathy Dhanapal, Ph.D.; Jayen Diyora; Igor Gorsky; Benjamin Grosjean; Richard Hall Hall; Solenn Janvier, Ph.D., Ovais Mohammad; Mariann Neverovitch; Jeffrey Rufner; Siegfried Schmitt, Ph.D.; Osamu Shirokizawa; Steven Shull; Stephen Spiegelberg, Ph.D. and John VanBershot “Risk-Based Analytical Method Selection In Cleaning Validation Using ASTM International Standards” Pharmaceutical Online October 2025
- Walsh, Andrew, Miquel Romero-Obon and Ovais Mohammad. "Calculating the Process Capability of Cleaning Processes from Total Organic Carbon Data" Pharmaceutical Online January 2022
- https://www.fda.gov/drugs/guidances-drugs/questions-and-answers-current-good-manufacturing-practice-requirements-equipment#TOC
- 7th International Institute for Research Cleaning Validation Conference (1996) https://www.researchgate.net/publication/327968158_7thIIR_CleaningValidationConference_
AndyWalsh - Wheeler, Donald, Ph.D. "Properties of Probability Models, Part 3: What they forgot to tell you about the lognormals" Quality Digest Daily, October 5, 2015
- Jover, L. F., Effler, T. C., Buchan, A., Wilhelm, S. W., and Weitz, J. S. (2014). The elemental composition of virus particles: implications for marine biogeochemical cycles. Nature Reviews Microbiology, 12:519–528 doi: 10.1038/nrmicro3289.