
Risk-Based Postmarket Surveillance (PMS) In The Age Of EU MDR: Risk-Based Trending
By Jayet Moon, author of the book Foundations of Quality Risk Management
As the central focus of the EU’s Medical Device Regulations (MDR), postmarket surveillance (PMS) and its related processes and subsystems have been in the limelight since 2017. This four-part series, using a fresh perspective, takes a bottom-up approach to PMS and starts by elaborating on the state of the art on the incident investigations in Part 1. “Investigations” are the basic iota of the PMS system upon which all further analysis, synthesis, and decision-making is based. With clarity on this most fundamental unit of PMS, a systems approach to both EU MDR and PMS are explored in Part 2. Successful implementation of an effective EU MDR-compliant PMS requires a systems approach which requires appreciation of not only the organizational context within which PMS operates but also the knowledge management as it relates to PMS generated data, information, knowledge, and wisdom. Part 3 focuses on the bedrock of EU MDR: the risk management system. It not only explores the interfaces between risk management and PMS but also discusses the postmarket aspects of risk surveillance and their accomplishments. Part 4 details an important upcoming topic with relevance going beyond EU MDR. Risk-based incident trending for postmarket signal detection is quickly becoming an expectation from most regulatory agencies and EU MDR is one of the first regulations to expressly document this requirement. The regulation asks for a methodology to gauge “statistically significant increases” in a certain subset of postmarket incidents. This article details salient features of any such method such that any chosen tool can act as a postmarket risk monitor and, if used right, can also convert the lagging indicator of complaints and incidents into a leading key risk indicator. Key risk indicators can help establish preemptive preventive actions before benefit-risk profile can be adversely impacted.
“Trending” postmarket incidents has often been a topic of some debate since very little official guidance exists in this regard. Until 2017, regulatory bodies only implicitly expected trending as part of postmarket data analysis. For example, FDA, does not mention trending in CFR 820.198 but does expect “analysis” (which the FDA does not define and seems open-ended depending on the context) with appropriate statistical tools, where applicable, in accordance with 820.198 and 820.100. My conversations with FDA revealed that it has seen far too often the misuse of statistics by manufacturers in an effort to minimize instead of address the problem. Such misuse of statistics would be considered a violation of these sections in the U.S. regulation. Hence, the foremost aim of the trending process is the same aim as that of the PMS system: to actively assist in monitoring and betterment of quality, safety, and performance of the device, where necessary, by corrective and preventive actions.
EU MDR is one of the world’s first regulations to not only require trending per Article 88 in an explicit manner but also require reporting of statistically significant increase in certain trends. Don’t see this as a regulatory burden. Instead, it adds “trending” to the data analysis tool chest of the medical device manufacturer to be used as a postmarket, post-production risk tracker, risk monitor, and decision-guiding tool.
This article will discuss the salient features of a sound risk-based trending process and methodology, and will also discuss what to look for in a trend analysis. The risk basis of a trending process derives from:
- How does the trending tool, method, and methodology interface with risk management?
- How does the trended metric act as a risk indicator?
- How does the threshold (and excursion thereof) of the tool for the trending process interface with the risk management process?
- How does the trending process incorporate frequency and severity of postmarket incidents?
The aim of the trending system is to detect signals. These signals should be readily understood by the risk management function such that any change in benefit-risk can become immediately apparent. It is important to take time to develop the trending methodology and at the same time ensure that the metric(s) to be trended can be readily accepted and understood by the risk management function. Your postmarket trending process should have very clear interfaces defined with the organizational risk management system.
The trending process comprises the following four steps:
- Establishing metric(s) to trend (e.g., Key Risk Indicator[s])
- Establishing baselines
- Understanding the signals, threshold, and triggers
- Investigating and reporting the excursion
Establishing The Metric(s)
The raw data to be gathered for trending are the number of events in a given time interval and the related used product volume in the market during that time interval. A data point is calculated for each time interval and can be defined as the observed incidence expressed in absolute gross count or as a ratio, percentage, or fraction. This becomes the trended metric. Metrics are almost always a function of time. In some cases, trending might also be initiated for clinical findings or other variables such as age, weight, gender of patients and other demographics. The trended metric should be treated as a key postmarket risk indicator.
What Is A KRI?
A KRI is a metric that provides a leading or lagging indication of the current state of risk exposure on key objectives. KRIs can be used to continually monitor and assess the current and predict future risk exposure.1 Through incoming PMS data, you can trend gross complaint intake, rate of malfunctions, outcomes, part/components issue, frequency of harms and health effects, etc. Continuous assessment of these indicators and monitoring their distance from the threshold levels can provide great insights into the risk profile as it changes due to real-world events.
Establishing Baselines
A baseline is a line serving as a basis used for comparison and is one of known measure or position used to calculate or locate distance or difference of current data over historical data. In complaint incident trending, when graphical techniques such as time series and control charts are used, the horizontal reference line (the center line, usually an average over certain months) serves as a good baseline. In a risk-based approach to trending, compare the difference of this average (real-world rate) to the predetermined level in the risk documents and take action to align the two. The occurrence of harms, hazardous situations, and failure modes can be easily trended and compared with the risk file in this manner. When establishing baseline, give due consideration to the trending time interval.
The typical number of events in a given time interval will vary depending upon the type of metric and may range from one or two events to hundreds or thousands. The chosen time interval should be long and rational enough to gather sufficient data for the analysis depending upon the volume of products used/sold and incidents reported. At the same time, the time interval should be short enough to facilitate timely corrective action, especially in case of high-risk products. Some manufacturers (based on the volume of incidents) can choose to chart the metric daily and review the signals weekly to keep a tighter pulse on trends and reduce the “lag” between real-world event, charting, analysis, and action.
Understanding Signals, Thresholds, And Triggers
A signal is an observable change in a quality of a phenomenon and contains information regarding the phenomenon. A signal usually displays some variation that can be analyzed to gain information about the nature of change in the phenomenon it is supposed to represent. Here, the phenomenon refers to the postmarket behavior of the medical device. The chosen trended metric and signal should be able to represent this behavior as closely as possible. The upper value of the normal range of variation that specifies the trending is called the threshold. Once the signal breaches the threshold, we arrive at a trigger condition.
What Are Trigger Conditions And Why Should They Be Monitored?
Trigger conditions occur when a set threshold or boundary for complaint or incident levels is breached. The main aim of trend monitoring and tracking is to assess the complaint/incident level (baseline) with respect to the threshold to check for a statistically significant excursion (trigger). The most common and obvious trigger conditions are pre-established occurrence rates, severity (impact) levels, and corresponding risk levels (in failure mode and effects analyses [FMEAs] or other risk documents). It may not always possible to reassess each and every risk per complaint or per event. In such cases, the metric (the KRI, e.g., number of complaints per week) should have an upper and a lower threshold, whose breach may guide us toward a more thorough and complete risk reassessment. If the KRI is a chart of discrete events on a time series, then a three-sigma standard deviation from the historical mean may be an example of the threshold. If the indicator breaches the set sigma limit, it may warrant a full risk reassessment and the associated analysis.
In addition, the level of attention a KRI generates can be divided per the level of the breach. For example, a two-sigma breach can be a local functional threshold, a three-sigma breach can be the site management threshold, and a four-sigma breach can be a top management threshold. This can help decide urgency or action and direct proper resources toward the future actions for change in risk exposure.
To monitor the trigger condition, you must not only establish a threshold but also detail the response after its breach. The response to excursion always starts with an investigation. The action may be as simple as a specific product-level risk reassessment or more detailed risk cluster review. Signal detection is just the beginning. The procedure for trending and risk management should define action loops upon discovery of a bona fide signal. Trending should interface with the corrective and preventive action (CAPA) system and risk management system at the same time.
An example of a trend chart that includes occurrence and harms (severity) is the J chart shown below:
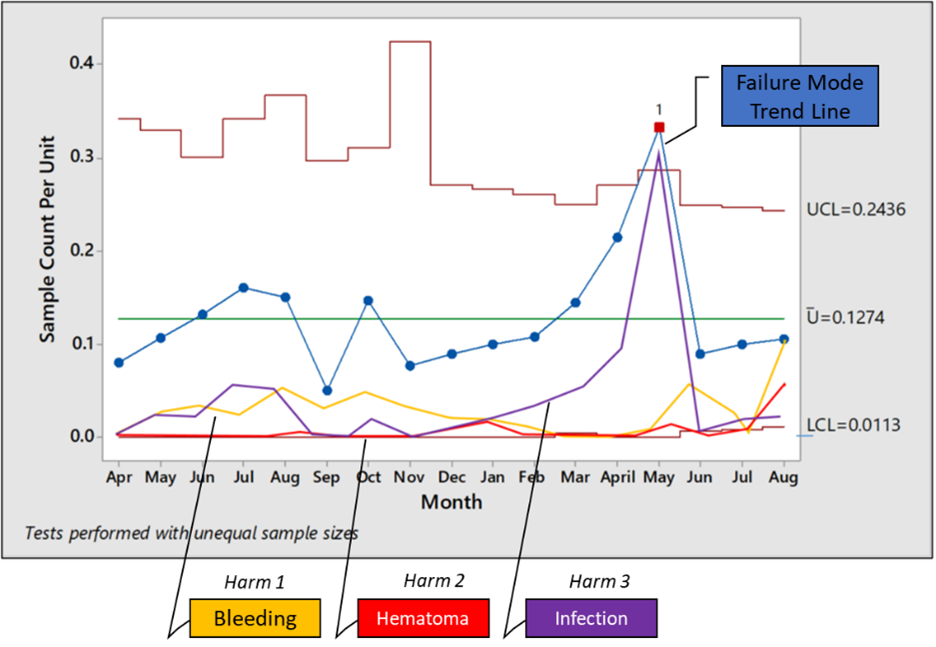
Figure 1: A J chart that includes occurrence rate and harm2
A J chart is nothing but a U control chart with three sigma upper and lower control limits for a particular failure mode. The distinguishing feature of this chart is the addition of trendlines for various harms. Thus, in one time series, you can examine the occurrence rate of the failure mode as well as the trends of occurrence of various harms resulting from the failure mode. This can be combined with the risk levels by risk reassessments at appropriate times as seen below:
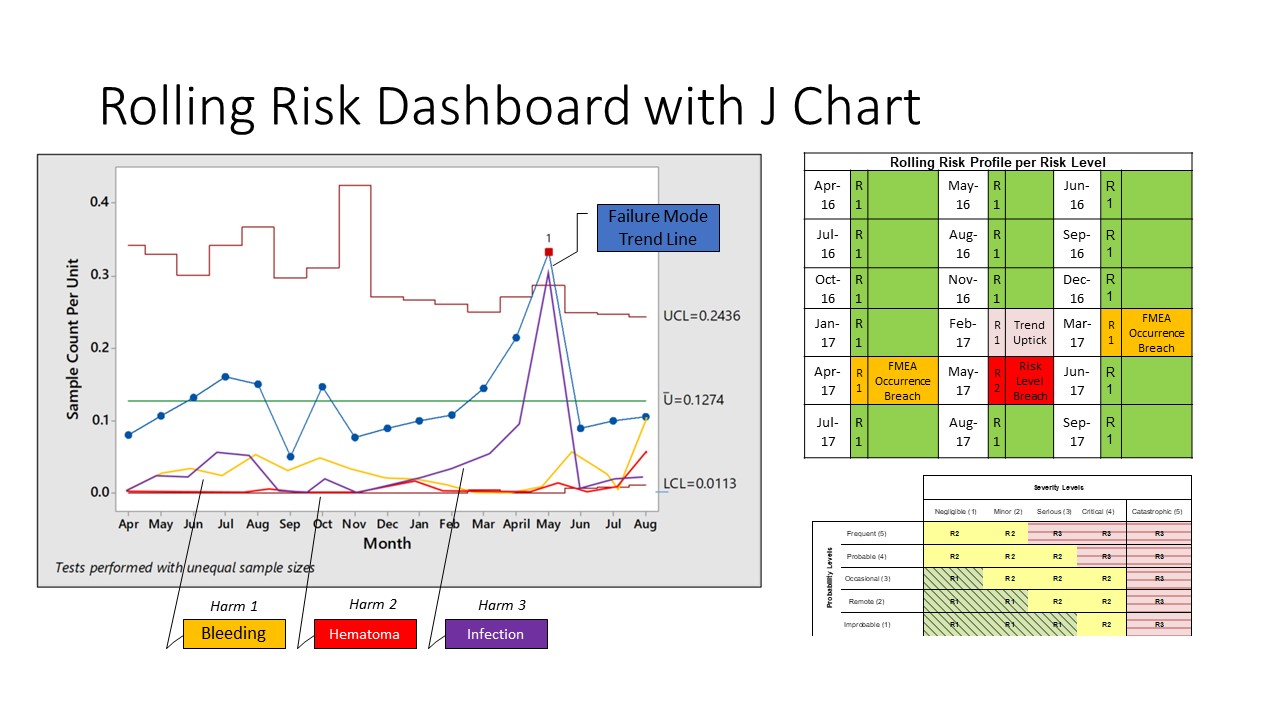
Figure 2: A J chart with a risk-tracking matrix
Investigating And Reporting The Excursion
When trending postmarket incidents, the biggest challenge is making sense of the signal so that targeted and specific action can be taken to improve the safety and performance of the product. Depending on the metric and trending technique, various levels of secondary processing might be needed to get to the actual meat of the signal. A way to do this is through stratification. ASQ defines stratification as the act of sorting data into distinct groups or layers. It is a technique used in combination with other data analysis tools. When data from a variety of sources or categories have been lumped together, the meaning of the data can be difficult to see. This data collection and analysis technique separates the data so that patterns can be seen and is considered one of the seven basic quality tools.
The need for stratification arises due to the nature of KRI or metric or trending process. For example, if the gross complaint rate is trended using a time series chart, this data includes complaints for all failure modes, all hazards, and all harms. If the threshold is breached, it could be for any one or two specific types of the above listed issues. Stratification here means separately analyzing the cause of the excursion of the trended metric, e.g., which failure mode is causing the uptick in trend? Or which harm is the most common outcome due to excursion as result of a certain hazardous situation?
Before trending data, brainstorm which information about the sources of the data might have a confounding effect on the signal. Set up the trending system such that the signal will be as close to the risk management metrics (i.e., occurrence rates of failure mode, hazardous situations, or harms) in the risk files.
Analyze the subsets of stratified data separately. For example, as shown below, stratification helps in resolving the signal into its source components. You can then check the sources in terms of their contribution to the signal. After this filtering step, compare the stratified levels of occurrence to the risk management file and take appropriate action.
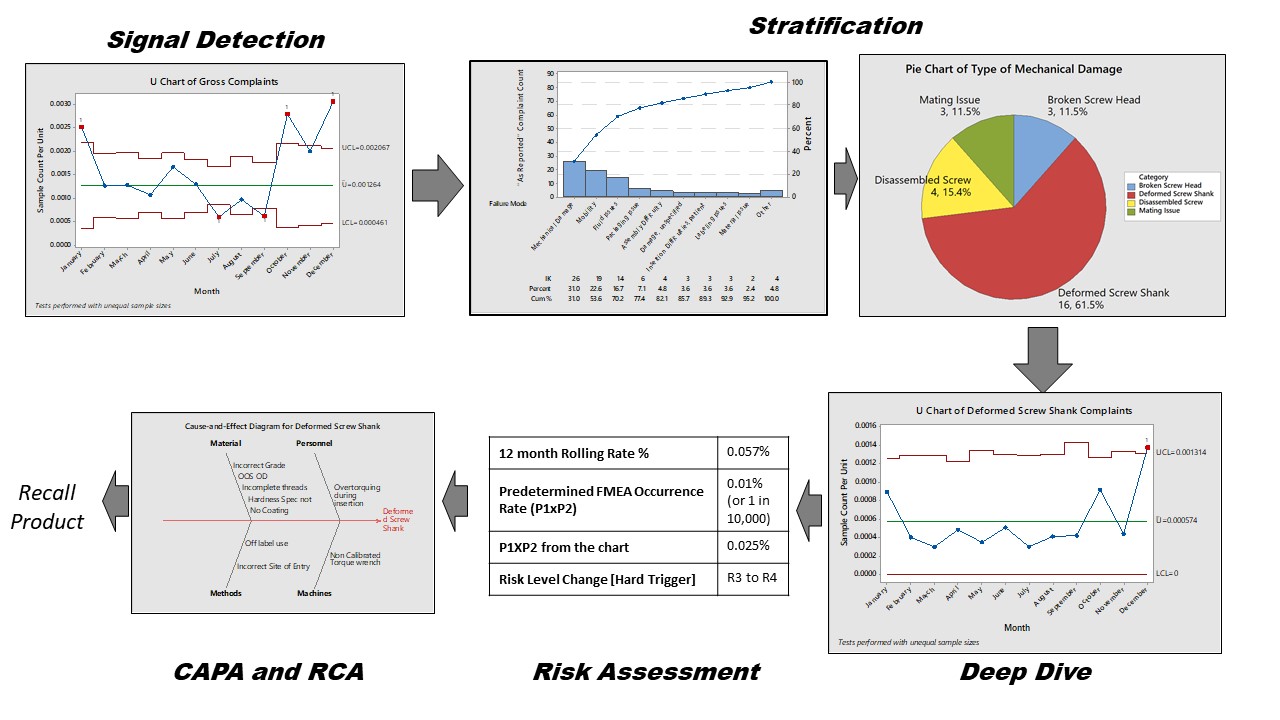
Figure 3: Trend investigation and stratification
ISO 20416:2020 mentions that there may be three types of changes that can be indicated by a trend analysis:
- A deviation sudden and significant enough to be classified as an excursion from normally varying limits of trends
- Consistent, repeated deviations or continuous drifting of values toward a new baseline
- Cyclical trends
All serious adverse events are already expected to be reported to the regulatory authorities. Per new manufacturer incident report forms, you must report sales/batch volumes along with annual gross complaint numbers. The aim of this is for the regulatory authorities to keep track of failure and adverse event rates themselves. However, the non-reported incidents can also affect device risk profile.
The cumulative non-serious, expected events/effects can also impact benefit-risk and are the ones that we should pay close attention to during trending.
EU MDR Article 88 expressly directs the company to report a trend if all the following conditions are satisfied:
- The presence of a statistically significant increase in frequency or severity
- The trend involves non-serious incidents or undesirable side events
- This statistically significant increase could have impact on benefit-risk
Significant increase should not be only statistically defined but also compared against the predefined level in the risk file, so it is important that the trended metrics and risk files speak a common language. Finally, the regulation says there should be a documented process for establishing this statistically significant increase.
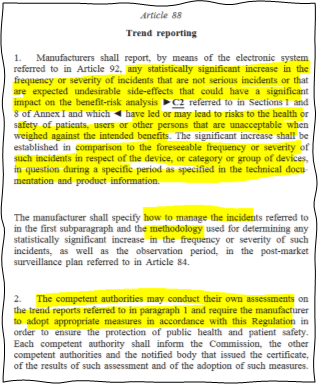
Figure 4: Article 88 from EU MDR
Some guidance on the definition of “significant increase” comes from GHTF-SG2-N36-R7:2003. While this document is slightly old (2003) and it is guidance for trending adverse events rather than non-serious events, the fundamentals are sound and can be used for trending across the board. It identifies “significant increase” as:
- A rapid and continuous increase of the trended metric over a limited number of time intervals for high-volume products (e.g., over 1–3 months)
- A slow and continuous increase of the trended metric over a large number of time intervals for low-volume products (e.g., over 3–6 months)
GHTF-SG2-N36-R7:2003 also introduces an important concept called range of variance (RoV), which applies to many trending tools. Normal RoV is simply the space within which the trended metric is expected to operate when the variance is common, normal, and acceptable, i.e., the space between pre-established thresholds. This is shown in Figures 5 and 6 below, which are directly reproduced from the guidance document.
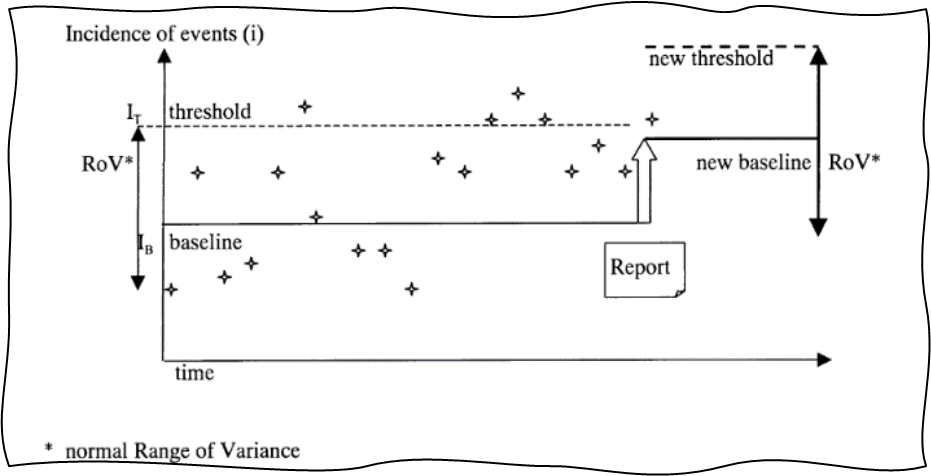
Figure 5: RoV and upward shift of baseline and threshold. Image courtesy of the Global Harmonization Task Force Study Group 2.
Breach of normal RoV creates a trigger condition and should be investigated. At the same time, a well-functioning PMS and CAPA system will result in targeted improvement, which will decrease certain postmarket incidents and will lead to new lower baselines of complaints and lower normal RoV. Thus, trending can also act as a great tool for verification of effectiveness of CAPAs. It is important to adjust thresholds as new lower baselines are established.
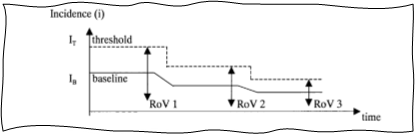
Figure 6: Effect of improvements of baseline and RoV. Image courtesy of the Global Harmonization Task Force Study Group 2.
In conclusion, it is safe to say that trending postmarket incidents is a specific science that depends largely on the organizational context. There is no “one size fits all” tool for trending, but the underlying fundamentals detailed in this article are simple and universally applicable. While trending is a new regulatory requirement, it’s not a new science. Many medical device companies, pharmaceutical companies, and regulatory bodies have had mature trending approaches for years. Outside of the healthcare fields, technical trend analysis in the stock market is quite pervasive, and even the famous Baldrige criteria of the Malcolm Baldrige National Quality Award identifies trending as one of the four factors used to evaluate organizational results.
Trending is like keeping a pulse on your product, service, processes, or systems, depending on the metric you choose. The pulse will vary within normal limits for a stable process, but if it sometimes goes above normal range, you made need an intervention to bring it back to stability. Once stability is established, you can adjust baselines to reflect improvement or positive outcomes from CAPAs. In this regard, continual checking of trends and their direction of movement can be an excellent aggregate graphical snapshot of things as they were (the past state), things as they are (the current state), and predictor of things to come (the future state), and at the same time, act as a preventive risk monitor.
Acknowledgments
The author thanks the following two colleagues for input:
- Angelina Hakim, founder and CEO of Qunique, a quality and regulatory consultancy based in the European Union
- Veronica Cavendish-Stephens, vice president of quality and risk management of Auchincloss-Stephens, a global firm specializing in quality risk management solutions.
References
- J. Moon, “Theory and Application of J Charts for Holistic Risk Based Statistical Adverse Event Trending,” Int. J. Health Econ. Devel. 4 (1), 9–31 (2018).
- J. Moon, Foundations of Quality Risk Management (ASQ Quality Press, Milwaukee, WI, 2020).
About The Author
 Jayet Moon earned a master’s degree in biomedical engineering from Drexel University in Philadelphia and is a Project Management Institute (PMI)-Certified Risk Management Professional (PMI-RMP). Jayet is also a Chartered Quality Professional in the UK (CQP-MCQI). He is also an Enterprise Risk Management Certified Professional (ERMCP) and a Risk Management Society (RIMS)-Certified Risk Management Professional (RIMS-CRMP). He is a doctoral candidate at Texas Tech University in systems and engineering management. His new book, Foundations of Quality Risk Management, was recently released by ASQ Quality Press. He holds ASQ CQE, CQSP, and CQIA certifications.