
Applying Lean Thinking To Support Processes in MedTech, Biotech Organizations
By Darren Dolcemascolo, EMS Consulting Group, Inc.

In regulated industries like medical device and biotech, processes stemming from the need to maintain regulatory compliance can impede the speed at which products can be produced and shipped. These processes include quality assurance reviews (QARs), quality control (QC) tests and inspections, and document control procedures.
This article answers the question, “how can lean thinking be applied to these areas to remove waste while still maintaining strict adherence to regulations?”
Just as we map the value stream and focus on shortening lead time and eliminating waste in manufacturing, we must observe and map these processes to better understand them and eliminate waste. After we identify the waste and areas ripe for improvement, we can apply traditional lean concepts — such as continuous flow, pull systems, layout changes, 5S principles, visual controls, and error proofing.
To demonstrate this concept, consider the case of a small biotech company’s process for receiving materials into stock for use in production. Regulations require that materials are properly verified before being used in production, but the regulations should never be used to excuse poor lead time performance.
Considering this, the company’s goal was to reduce its overall value stream lead time. Since this particular process contributed significantly to the overall lead time, it was selected for improvement. Company leadership selected a team to work on this opportunity; the team’s problem statement, goal, and data gathered are summarized below.
Problem Statement: Time from “materials on dock” to “inventory released to stock” currently is 10 business days. This slows down the overall lead time from receipt of material through to customer shipment and results in a lot of expediting and waste.
Aim/Goal: Develop a future state with a total lead time from “receipt” to “stock” of < 4 days
Volume and Customer Requirements
- 6 Lots/Day Average
- 3-Day or Faster Turnaround Time (Lead Time)
Workflow and Time Data Collected
- Delivered items are received into the system by Receiving, and then placed into Quarantine.
- Processing Time: 60 Minutes
- Lead Time: 1 Day
- A second Receiving/Warehouse Associate performs a verification (to ensure that the correct item was received.
- Processing Time: 2 Min.
- Lead Time: 1 Day
- Quality Assurance (QA) picks up the paperwork in Building A (where receiving is located), walks to Building B to verify the item specification, and passes the paperwork to the QC inbox.
- Processing Time: 23 Minutes
- Lead Time: 1 Day
- QC picks up the paperwork from the inbox and checks the certificates of conformance.
- Processing Time: 5 Minutes
- Lead Time: 1 Day
- A QC supervisor performs a second verification.
- Processing Time: 5 Minutes
- Lead Time: 1 Day
- A QA associate picks up the paperwork, fills out a disposition form, and prints labels.
- Processing Time: 12 Minutes
- Lead Time: 1 Day
- A second QA associate picks up the paperwork and performs a second verification.
- Processing Time: 5 Minutes
- Lead Time: 1 Day
- Another QA associate picks up the labels and paperwork and walks back to Building A to label the items.
- Processing Time: 30 Minutes
- Lead Time: 1 Day
- A second QA associate performs label reconciliation to ensure that all the labels have been used (or voided).
- Processing Time: 5 Minutes
- Lead Time: 1 Day
- A warehouse associate picks up the paperwork and physically moves the items out of quarantine and into a stock location. The associate also releases the item in the material requirements planning (MRP) system.
- Processing Time: 12 Minutes
- Lead Time: 1 Day
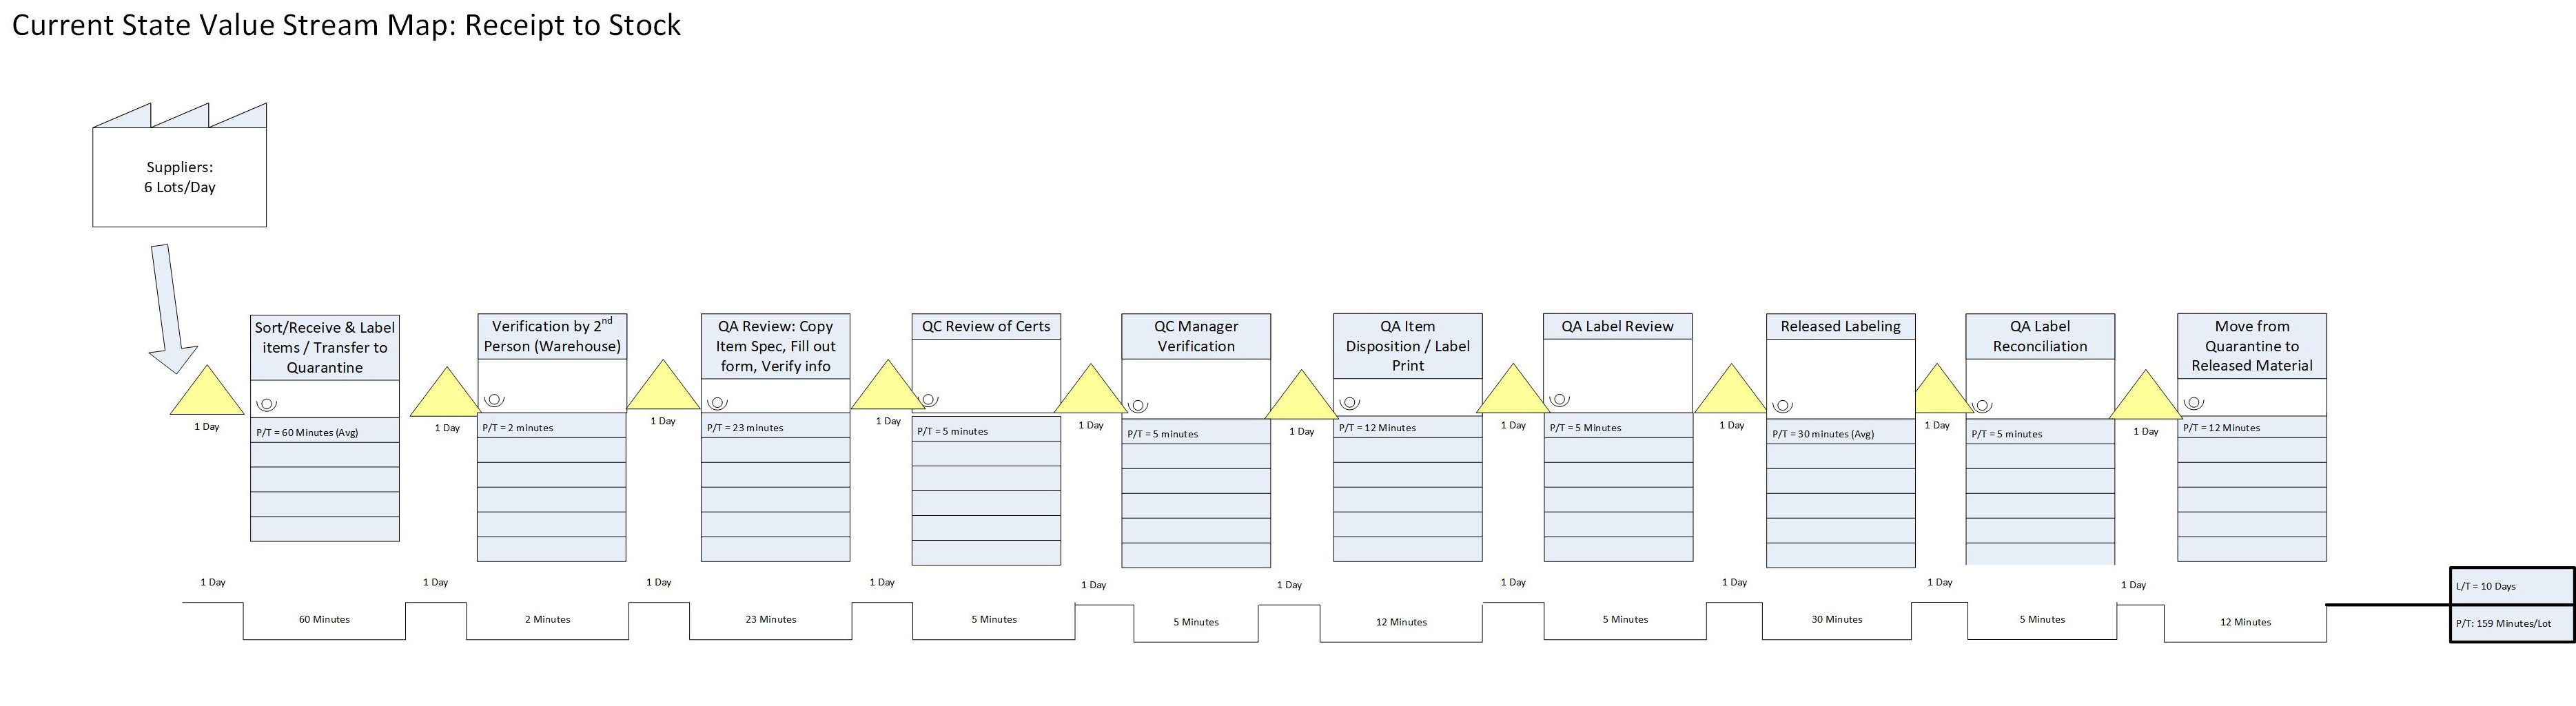
Current State Map
Note that each step has a one-day lead time, meaning that batches of approximately six (one day’s worth) are moved on to the next step and processed. Below is a depiction of the current state value stream (click to enlarge).
|
Summary Metric |
|
|
Lead Time from Receipt to Available Stock (Released) |
10 Days |
|
Processing Time per Lot |
159 Minutes |
Future State Analysis and Map
In developing its desired future state, the team followed this approach:
- What is the takt time and what are the customer requirements (e.g., lead time)?
The company needs to process six lots per day. Using a takt time calculation of working time/volume in 1 day and assuming 7 hours (420 minutes) of available working time, we have 420 minutes/6 units = 70 minutes. The lead time goal is to get the items to stock within 3 days.
- How will we measure performance to takt time?
The team decided that, in order to effectively measure performance to takt time, they would perform three checks per day on status. There should be no more than two lots in any single location. If there are more than two lots, then additional help will be utilized (temporarily moved from another resource) to get the lots moving again.
- How will we connect the flow?
To minimize handoffs and ensure that a different person verifies the work of the first person, the team proposed the following workflow:
- Warehouse associate receives and labels items “quarantine.”
- 1st QA associate verifies items, item spec, and certificates in the warehouse. This requires stationing QA personnel in the warehouse area.
- 2nd QA associate verifies that item spec and cert have been properly verified, and prints labels.
- 1st QA associate verifies labels and applies labels
- Warehouse associate performs label reconciliation and moves items into Stock.
This approach will require some cross-training and minor layout changes, but it minimizes handoffs and transportation while maintaining adherence to regulatory requirements.
- How will work be controlled between processes (where handoffs still exist)?
The lean approach requires a pull methodology. In the case of administrative work, we generally utilize the first in, first out (FIFO) lane concept, deliberately limiting the quantity of work in between two processes. The team decided a FIFO lane of two lots in between makes sense (meaning “inboxes” between processes have a maximum of two lots. The performance check concept above will handle cases where there is an overage to be managed.
- How will the workload and/or activities be leveled?
Utilizing the FIFO lanes and the performance check concepts, the lots will keep moving through the system with a maximum of two lots in between any two processes. This will ensure a much faster lead time; if the process falls behind, it will become visually obvious.
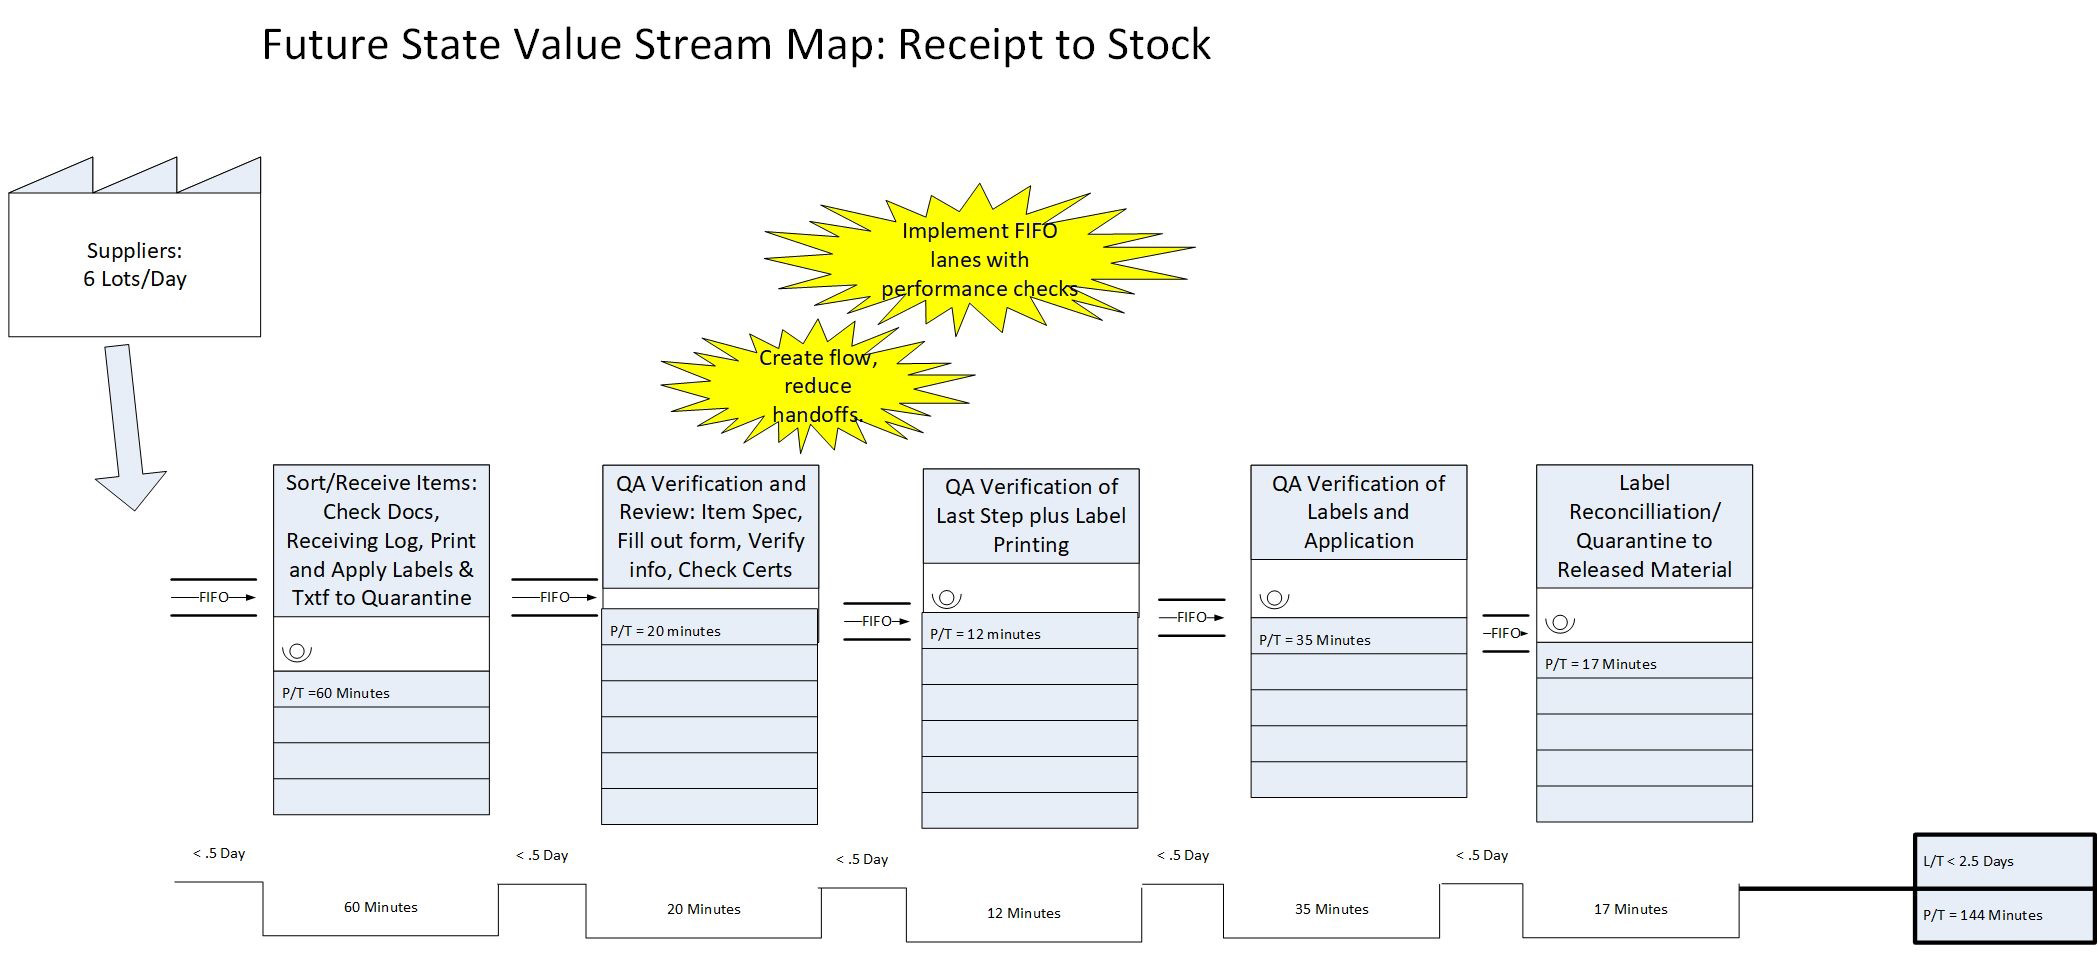
Taking this approach, the team was able to develop the following future state map (depicted below; click to enlarge), which they implemented within 60 days of completion of the value stream mapping exercise.
|
Summary Metric |
Current State |
Future State |
% Improvement |
|
Lead Time from Receipt to Available Stock (Released) |
10 Days |
< 2.5 Days |
75% |
|
Processing Time per Lot |
159 Minutes |
144 Minutes |
9% |
Results:
The company experienced a 75 percent reduction in lead time. Processing time was initially targeted for reduction of 9 percent -- about 15 minutes -- due to the reduction of handoffs and redundancies. Following implementation, the team retimed the process and found that the true reduction in processing time was closer to 25 percent.
This simple case demonstrates the idea that lean thinking can and should be applied to support processes within the medical device industry. There exist abundant opportunities to improve productivity and reduce lead times, which ultimately result in better customer service and overall company performance.